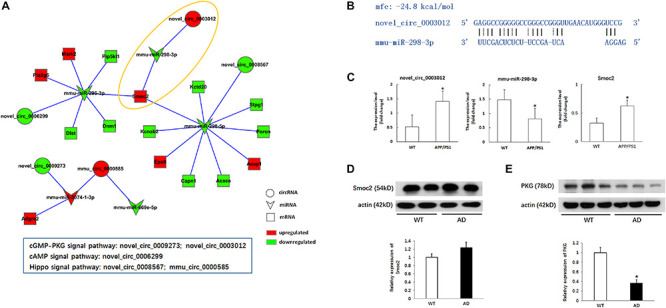
FIGURE 5.

Verification of the potential regulation mechanism of circRNAs in the key signaling pathways. (A) CircRNA-ceRNA network of circRNAs in the key signaling pathways. Circle nodes represent circRNAs, triangle nodes represent miRNAs, and rectangle nodes represent mRNAs. Red represent upregulated, green represent downregulated. (B) The interaction of novel_circ_0003012/mmu-miR-298-3p. (C) The expression levels of novel_circ_0003012, mmu-miR-298-3p and SMOC2 by qPCR in hippocampal tissues of 8-month-old APP/PS1 mice and WT mice. CircRNA and mRNA expression was quantified relative to Gapdh expression level by using the comparative cycle threshold (ΔCT) method. MiRNA expression was quantified relative to U6 expression level by using the comparative cycle threshold (ΔCT) method. Data are presented as means ± SD (n = 6; *p < 0.05). (D) The expression of Smoc2 by Western blot in hippocampal tissues of 8-month-old APP/PS1 mice and WT mice. Data are presented as means ± SD (n = 2). (E) The expression of PKG by Western blot in hippocampal tissues of 8-month-old APP/PS1 mice and WT mice. Data are presented as means ± SD (n = 3; *p < 0.05).
