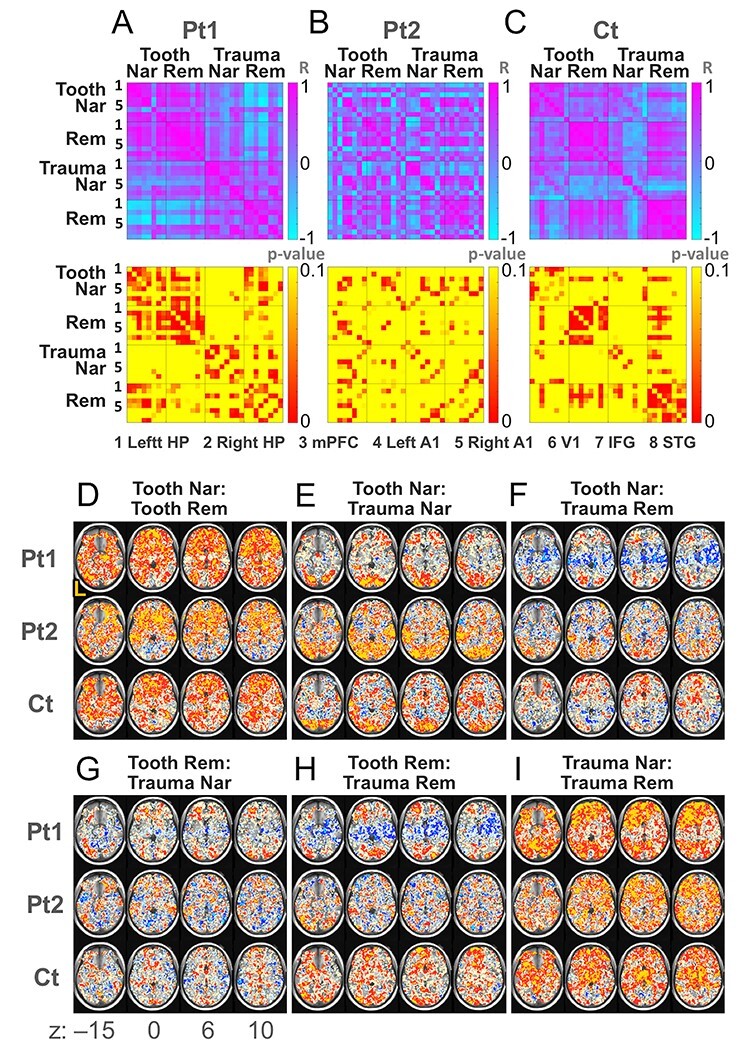
Figure 5.

Correlations among contrast estimates. (A) Correlation matrices of ROI-based correlation coefficients between the ACEs (upper panel) and the corresponding P values (lower panel) for Pt1, (B) Pt2, and (C) Ct. Left-hand numbers (only 1 and 5 are visible) correspond to 1) ROIs of the left hippocampus (HP), 2) right HP, 3) mPFC, 4) left A1, 5) right A1, 6) V1, 7) left IFG, and 8) left STG. Numbers in the right side of matrices indicate Pearson’s product–moment correlation coefficients (R) for upper matrices and the P values for lower matrices. (D) Correlation maps of voxel-based correlation coefficients between Tooth Nar and Tooth Rem, (E) Tooth Nar and Trauma Nar, (F) Tooth Nar and Trauma Rem, (G) Tooth Rem and Trauma Nar, (H) Tooth Rem and Trauma Rem, and (I) Trauma Nar and Trauma Rem. The left side of the maps represents the left side of the brain (L). Axial sections at z-coordinates of −15, 0, 6, and 10 in the Montreal Neurological Institute (MNI) spacee. Mustard color indicates voxels whose Spearman’s rank correlation coefficients are ≥0.8; red, ≥0.5; cream, ≥0.2; cyan, ≤− 0.8; blue, ≤− 0.5; and ice blue, ≤− 0.2.
