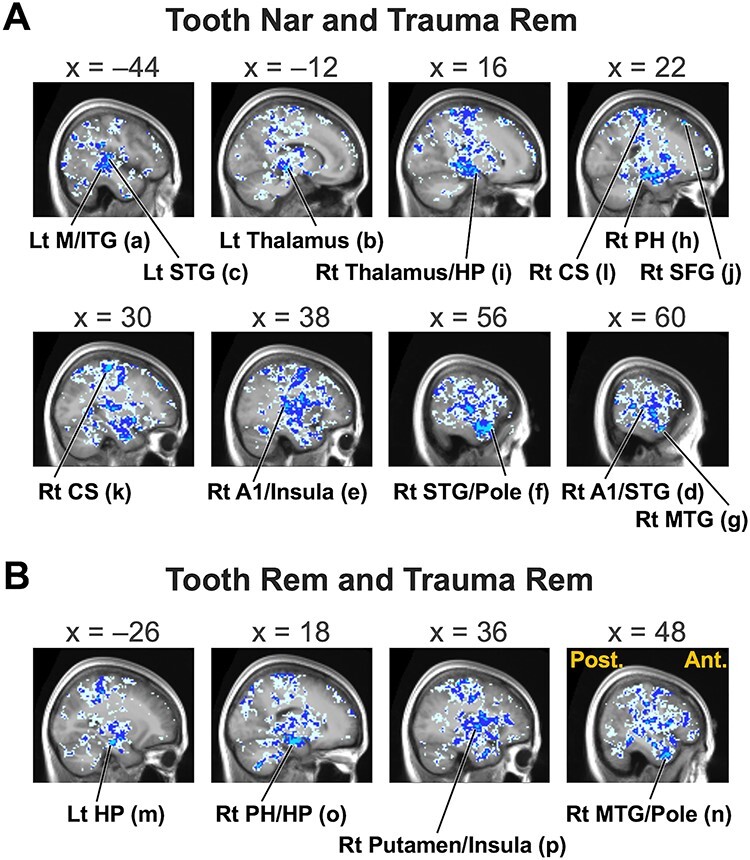
Figure 6.

Sagittal sections showing top negative correlations between Tooth Nar and Trauma Rem (A) as well as between Tooth Rem and Trauma Rem (B) in Pt1. x-coordinates correspond to the MNI space. Post., posterior; Ant., anterior; Lt, left; Rt, right. Labels (a)–(p) correspond to those in Table 2. Cyan color indicates voxels whose Spearman’s rank correlation coefficients are ≤− 0.8; blue, ≤− 0.5; and ice blue, ≤− 0.2.
