
Figure 1.
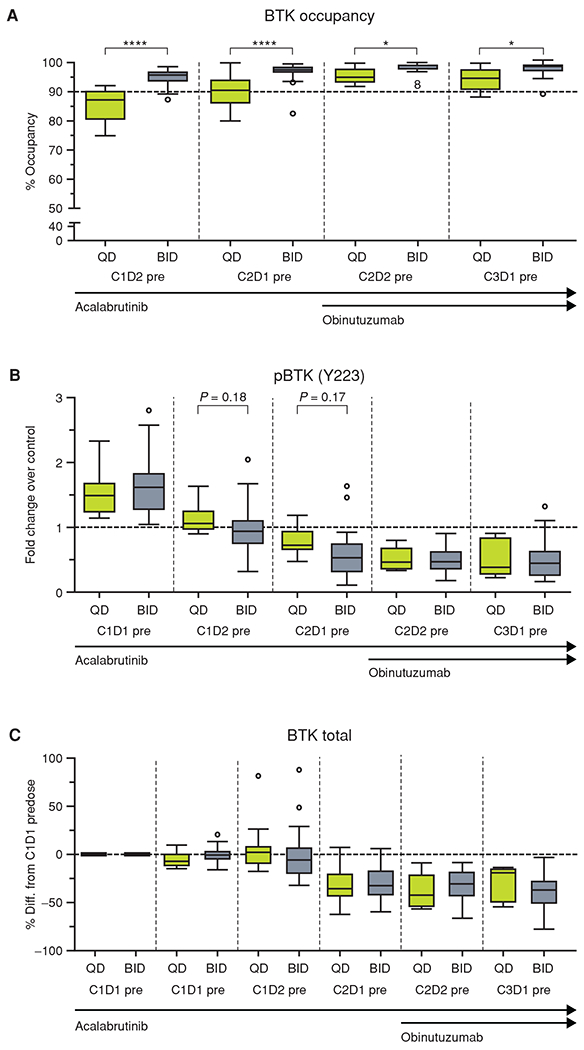
Pharmacodynamics of acalabrutinib. A, The percentage of BTK occupancy by acalabrutinib at each timepoint for patients with a signal to noise ≥5 for the day 1 presample. B, The pBTK fold change over control (C1D1 pre + 1 μmol/L exogenous acalabrutinib) for each timepoint. C, The BTK fold change over control (C1D1 pre + 1 μmol/L exogenous acalabrutinib) for each timepoint. For each figure, the horizontal line in the center of the box represents the median. Significance was determined using a paired two-tailed parametric t test: *, P < 0.5; ****, P < 0.0001. BID, twice a day; C, cycle; D, day; pBTK, phosphorylated BTK; pre, predose; QD, once a day.