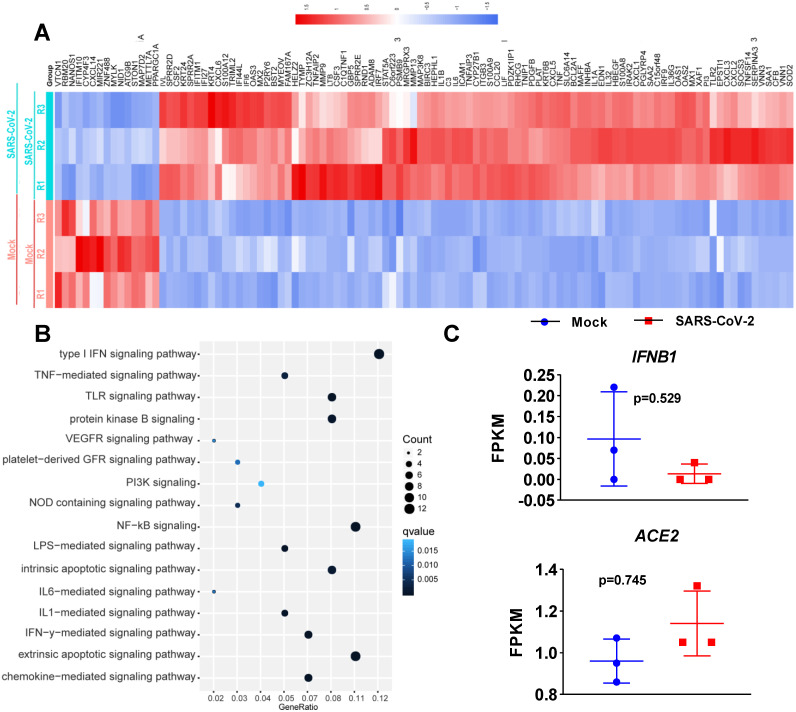
Figure 1.
Transcriptional response of primary human bronchial epithelial cells to SARS-CoV-2. A. Heatmap of differentially expressed protein-coding genes in SARS-CoV-2-infected NHBE cells compared with the corresponding mock-infected cells. B. Dot plot visualization of enriched GO terms in SARS-CoV-2-infected NHBE cells. Gene enrichment analysis of the differentially expressed genes between SARS-CoV-2- and mock-infected NHBE cells was performed. The colors of the dots represent the q values for each enriched GO term, and their sizes represent the number of genes enriched in the corresponding signaling pathway. C. Levels of the innate antiviral factors IFNB1, ACE2, IFI6, XAF1, MX1, MX2, IFITM1, IRF7, OAS1, OAS2, OAS3, IRF9, IFI27, ISG15, ISG20, OASL and CXCL10 in SARS-CoV-2- and mock-infected NHBE cells were determined as FPKM values. The p values were calculated with DESeq2 software.

