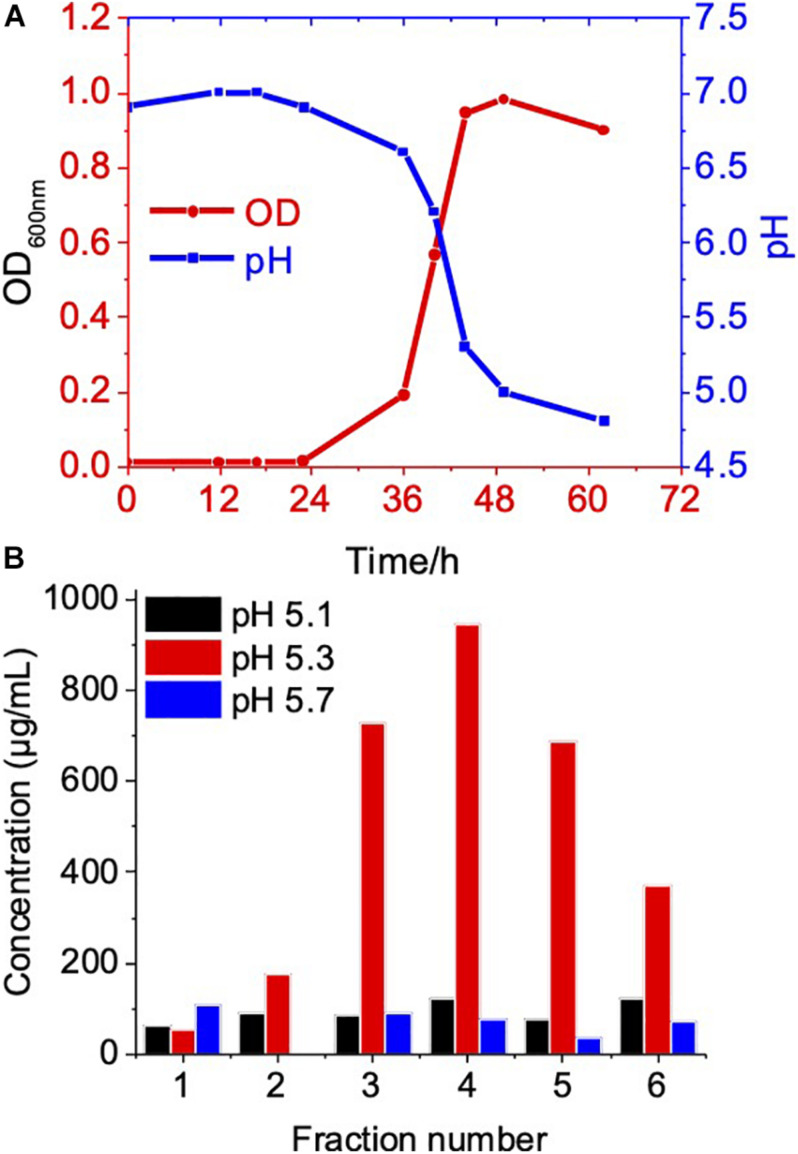
FIGURE 3.
Growth phase related OMV production in C. ochracea. (A) Time vs Growth curve of C. ochracea and pH profile of the nutrient medium measured during the growth. (B) Total protein concentration of OMV from gradient purified fractions of stationary phase (pH: 5.1), late exponential phase (pH: 5.3), and mid-exponential phase (pH: 5.7).

