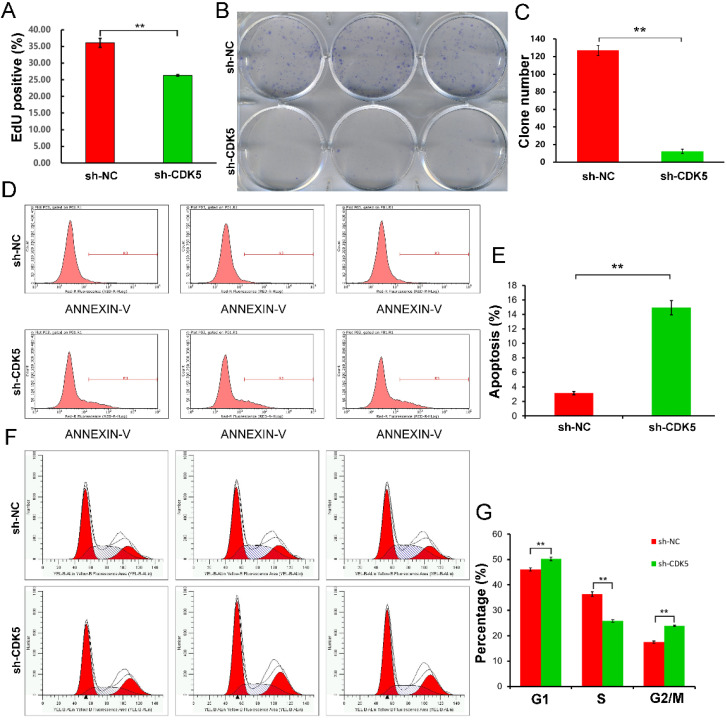
Figure 5.
Cell proliferation, apoptosis, and cell cycle assays. Proliferation was quantified using EdU and colony formation assays. (A) EdU staining showed that CDK5 knockdown, compared with control treatment, decreased the proportion of EdU-positive cells. Data are presented as mean ± standard deviation (SD); **P <0.01 vs. control, unpaired t-test. (B and C) Colony formation assay showed that the clonogenic ability of U251MG cells was impaired due to CDK5 knockdown. Quantitative results represent mean ± SD of three separate experiments; **P <0.01, unpaired t-test. (D and E) Flow cytometry analysis of apoptotic rates of U251MG cells treated with scrambled (sh-NC) or CDK5 (sh-CDK5) short hairpin RNA was performed. Quantitative data are presented as mean ± SD; **P <0.01, unpaired t-test. (F and G) Cell cycle distribution in U251MG cells infected with lentivirus expressing sh-NC or sh-CDK5 was analyzed by flow cytometry. Quantitative graph showed the mean ± SD values of the proportions of cells in the G1, S, and G2/M phases from three separate experiments; **P <0.01, unpaired t-test.

