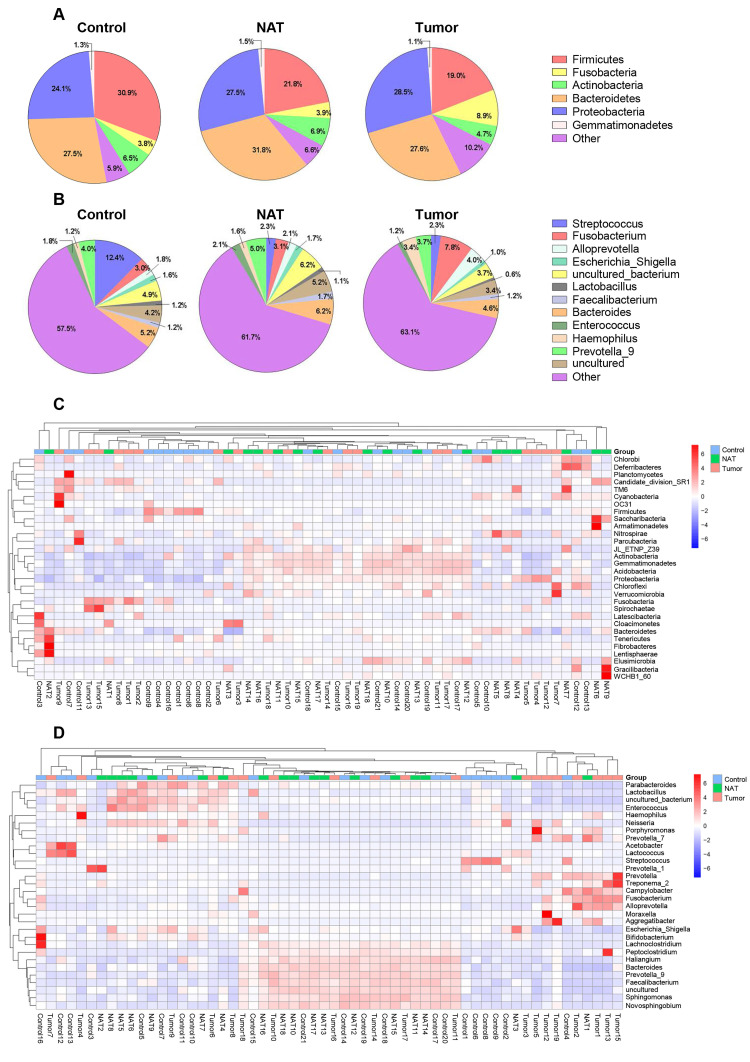
Figure 1.
Relative abundance of major bacterial phyla (A) and genera (B) whose proportions were greater than 1% in the vocal cords. The values are the mean sequence abundances in various groups and levels. Heatmap showing the relative densities of 30 of the most abundant phyla (C) and genera (D) of vocal cord tissue samples. Hierarchical dendrogram depicting the taxonomic assignments of vocal cord samples. The cluster branch groups above represent samples from different groups. The cluster tree on the left represents the cluster of genera. The legend in the upper-right corner of the figure indicates the colors that represent the relative abundances of genera in every sample (presented as a percentage of the total 16S rRNA sequences). Orange indicates a higher relative abundance of the genera, and blue shows a lower relative abundance. The tumor tissue and normal adjacent tissue (NAT) samples were taken from GLSCC patients, and the control tissue was sampled from subjects with vocal cord polyps.

