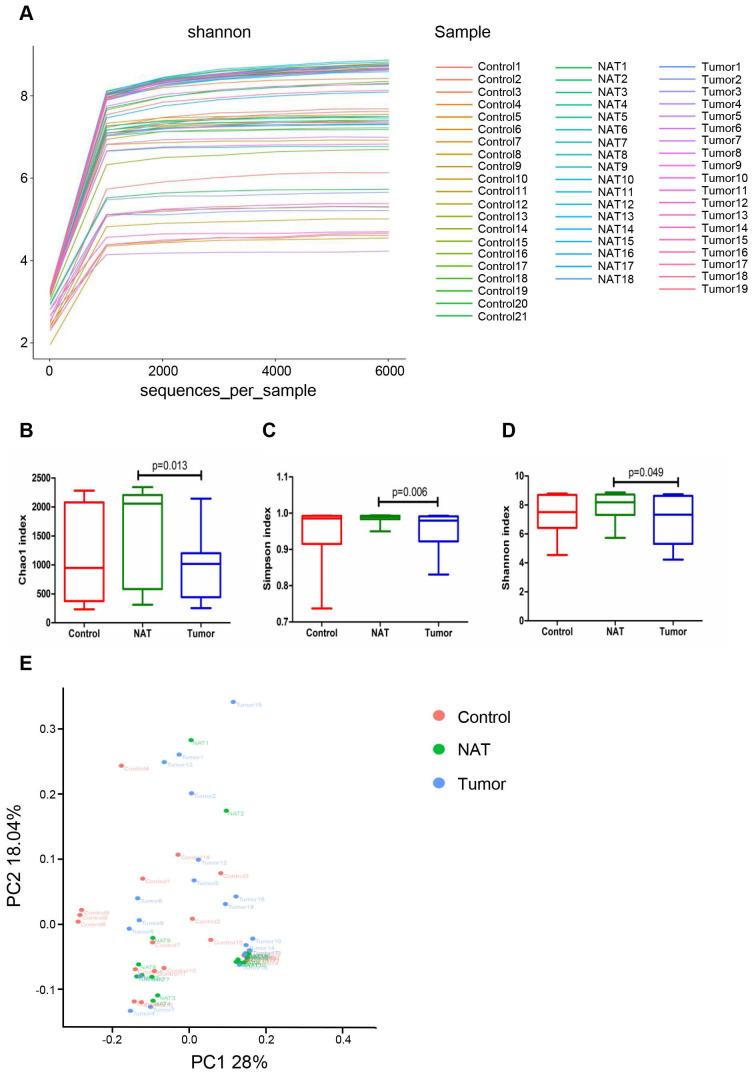
Figure 2.
Comparative analyses of the vocal cord bacterial communities of the three groups of tissue samples. Alpha rarefaction plot (A), Chao1 (B), Simpson index (C), and Shannon index (D) of the samples from the tumor tissue, the normal adjacent tissue (NAT), and control tissue were compared. These comparisons were not marked because P> 0.05 between groups. (E) Principal coordinate analysis (PCoA) using the weighted UniFrac distance of the vocal cord microbiota among the study participants. The weighted UniFrac distance significantly varied among the three groups (weighted UniFrac R2 = 0.067, P< 0.05).

