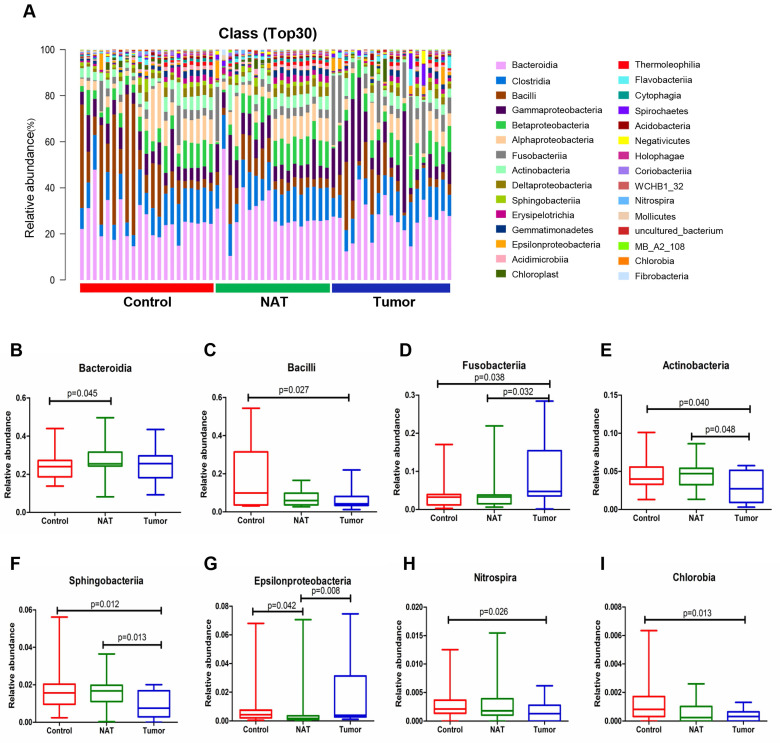
Figure 4.
Alterations in the vocal cord microbiota composition. (A) Histogram of the bacterial community structure distribution at the class level (top 30). Each column represents a vocal cord sample, and each color represents an individual class. (B) Bacteroidia. (C) Bacilli. (D) Fusobacteriia. (E) Actinobacteria. (F) Sphingobacteria. (G) Epsilonproteobacteria. (H) Nitrospira. (I) Chlorobia. Comparisons among groups were performed using Kruskal-Wallis tests. These comparisons were not marked because P> 0.05 between groups.

