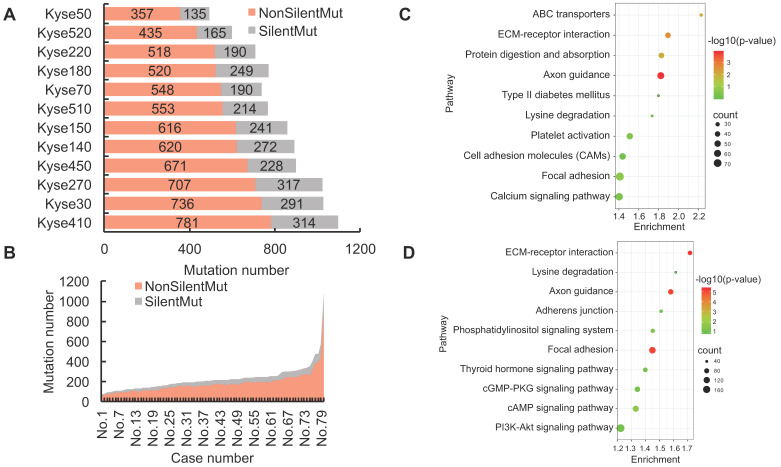
Figure 2.
The landscape of non-silent mutation heterogeneity in ESCC. (A and B) The grey color indicates the number of genes with silent mutations, and the red color indicates genes with non-silent mutations across the ESCC cell lines (A) and patient tissues (B). (C and D) The top ten significantly enriched KEGG signaling pathways from genes harboring non-silent mutations in ESCC cell lines and patient tissues, respectively. (E and F) A positive correlation was observed between the number of genes with silent mutations and genes with non-silent mutations in ESCC cell lines and patient tissues, respectively. (G) The number of total mutated genes and unique mutated genes across the 12 ESCC cancer cell lines. (H) The frequencies of non-silent mutated genes across ESCC patient tumor tissues.


