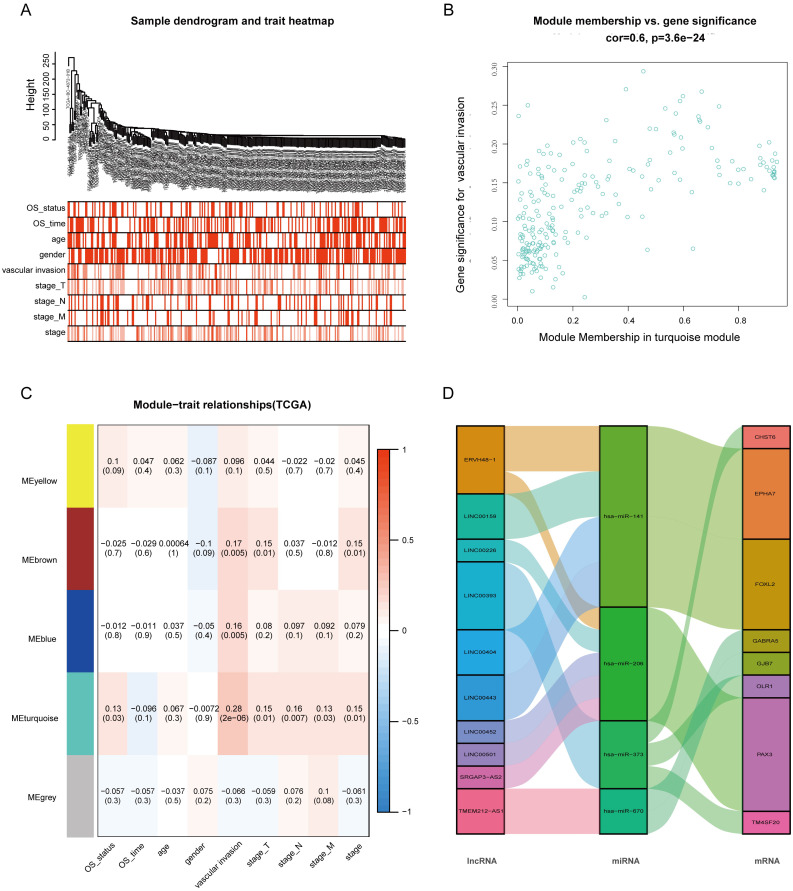
Figure 3.
Weighted gene co-expression network analysis (WGCNA). (A) Sample dendrogram and trait heatmap. (B) Correlation between gene modules and clinical traits. (C) Scatter plot of genes in the turquoise module. (D) Sankey diagram for the VI-related hub ceRNA network of HCC. Left bar: lncRNA; middle bar: miRNA; right bar: mRNA.

