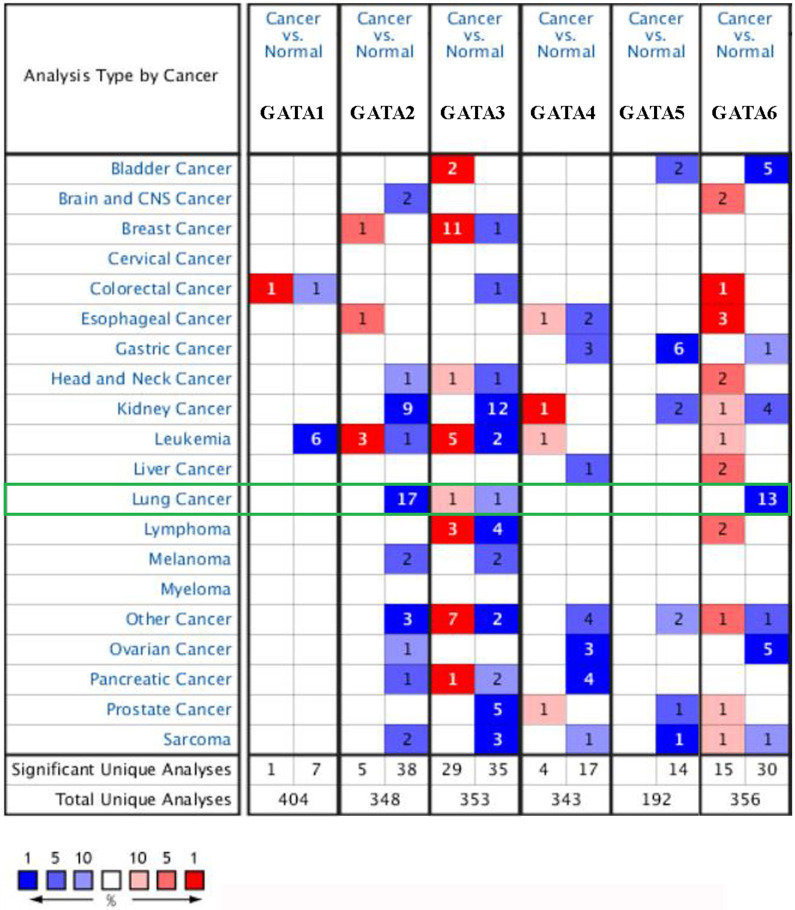
Figure 1.
The mRNA levels of GATAs in different types of cancers (Oncomine). The number in each cell represents the number of analyses that satisfied the following threshold: P < 0.01, the absolute value of log2 fold change >2, and gene rank, top 10%. The numbers in colored cells show the quantities of datasets with statistically significant mRNA overexpression (red) or downexpression (blue) of target genes.

