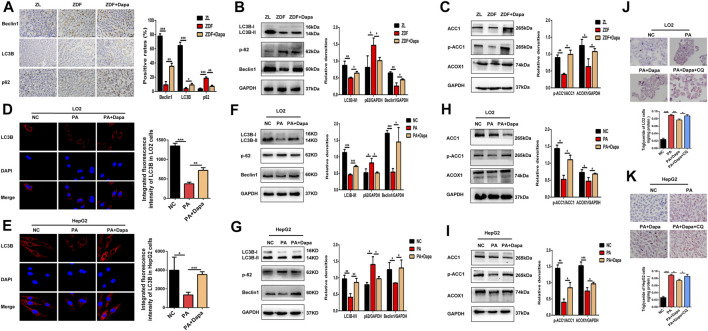
FIGURE 4.
Dapagliflozin induces autophagy and regulates fatty acid metabolism in ZDF rats and PA-stimulated LO2 and HepG2 cells. (A) IHC staining detected the expression of LC3B, Beclin-1 and p62 in hepatic tissue. Scale bars: 20 μm. Data are expressed as the means ± SEM of five animals per group. *p < 0.05, **p < 0.01, and ***p < 0.001 compared with the ZDF rat group. (B) Western blot analysis evaluated the protein expression levels of LC3B, Beclin-1, and p62 in rats. (C) Western blot analysis detected the expression of ACC1, p-ACC1, and ACOX1 in the livers of rats. (D, E) LC3B immunofluorescence staining showed the endogenous LC3B level of LO2 and HepG2 cells. (F, G) Western blot analysis demonstrated the expression of LC3B, Beclin-1, and p62 in LO2 and HepG2 cells. (H, I) Western blot analysis detected the protein expression of ACC1, p-ACC1 and ACOX1 in cells. (J, K) LO2 and HepG2 cells were treated with 0.3 mM PA, 20 μM dapagliflozin and 20 µM chloroquine (CQ) for 24 h. The cells were stained with Oil Red O and intracellular TG was quantitatively analyzed. Scale bars: 20 μm. Data are expressed as the means ± SEM from three independent experiments. *p < 0.05, **p < 0.01, and ***p < 0.001.

