Figure 2.
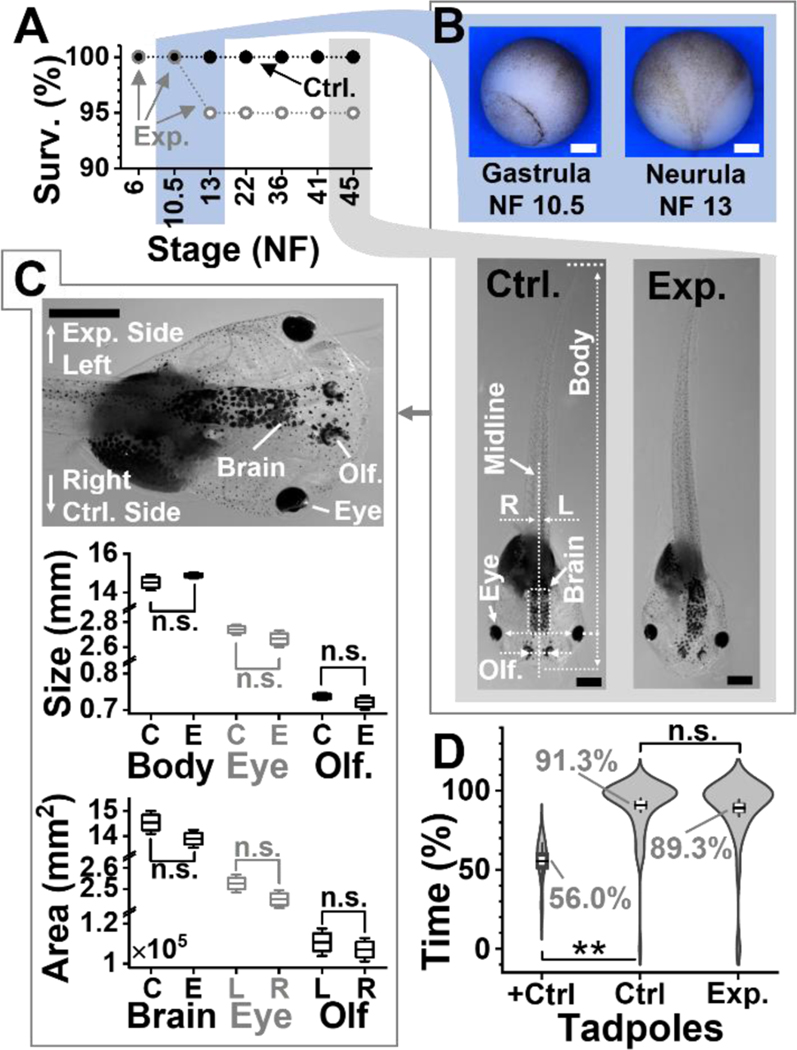
Developmental and behavioral impact of the technology. (A) Survival analysis (Surv.) at key developmental stages (NF, Nieuwkoop-Faber) for N = 20 embryos in the control (Ctrl.) group and N = 20 embryos in the experimental. (B) Representative (top panel) Ctr. gastrulae and Ctrl. neurula and (bottom) Ctr. and experimental (Exp.) tadpoles. Shown: midline separating left (L)-right (R) axis, body length, brain area, and distance between eyes and olfactory (Olf.) organs. (C) Comparison of tadpole anatomy. (Top) Close-up image of a tadpole showing the experimental (left) and control (right) side. Right tissues are labeled. (Middle) Analysis of organ size on the left (experimental side) between N = 5 Ctrl. (C) and N = 6 Exp. (E) surviving tadpoles randomly selected. Key: n.s., non-significant, *p < 0.05, Mann-Whitney test. (Bottom) Analysis of tissue areas for total brain (Ctr. vs. Exp. group), the eyes and, the olfactory organs in the 6 Exp. tadpoles. Key: n.s., non-significant, Wilcoxon signed rank, paired). (D) Comparison of visual function in a background-color preference assay for N = 16 Ctrl. vs. N = 15 Exp. tadpoles. Assay validation via double axotomy of the optic nerves in N = 4 positive Ctrl. tadpoles (+Ctrl.). Tadpole movies in Videos S1 (Ctrl.) and S2 (+Ctrl.). Key: n.s., non-significant; *p < 0.05, **p < 0.005 (Mann-Whitney). Scale bars, 250 μm (white) and 1 mm (black). Box-whisker plots: Box, 1×standard error of the mean (SEM), whiskers: 1.5×SEM.

