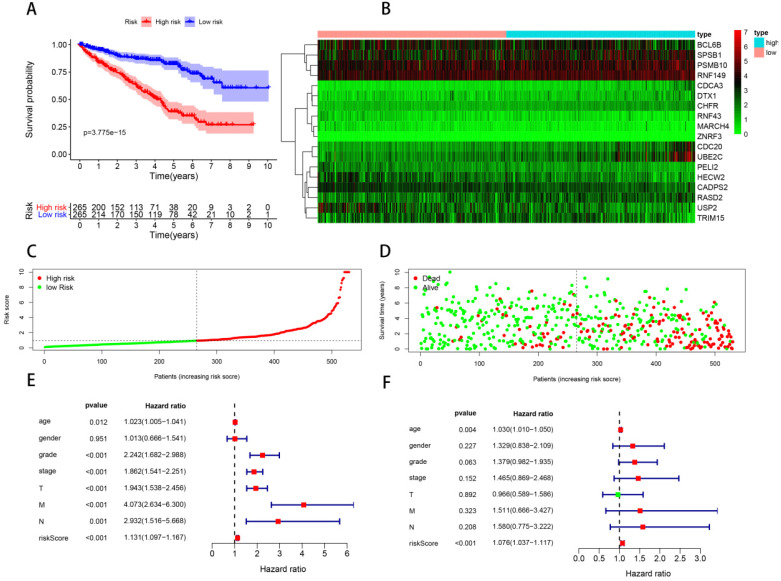
Figure 4.
Model 1: prognostic signature constructed with 18 differentially expressed UPSs. (A) Kaplan-Meier curves of OS in the high- and low-risk groups stratified by the median risk score. (B) Heatmap of the expression profile of the model genes in two groups. (C) Distribution of the risk scores of ccRCC patients. (D) Survival status of patients in different groups, red dots denote patients that are dead, and green dots denote patients that are alive. (E) A forest plot of univariate Cox regression analysis in the cohorts. (F) A forest plot of multivariate Cox regression analysis in the cohorts.

