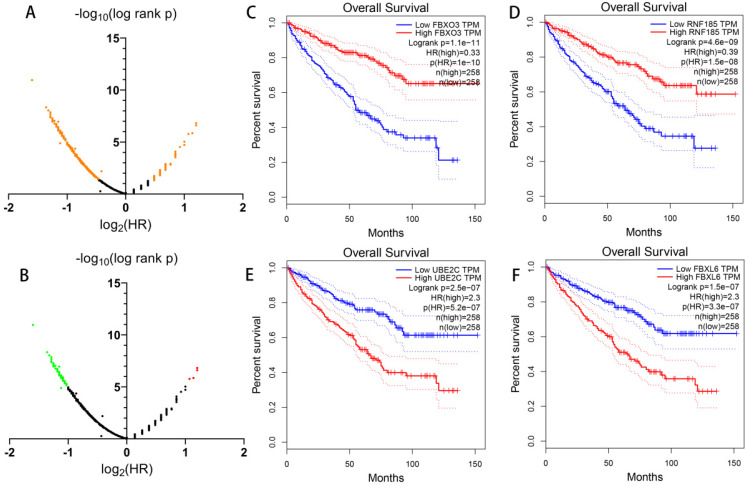
Figure 6.
Prognostic value of all UPS-related genes exploring with GEPIA. (A) Dot plot to show the large proportion of UPSs with significant prognostic value, significant genes are shown in orange. (B) Dot plot to show the UPSs with outstanding prognostic value, red dots represent genes when log2 hazard rate (HR) > 1, green dots represent genes when log2 hazard rate (HR) < -1. (C-F) Kaplan-Meier curves of OS of representative genes with outstanding prognostic value.

