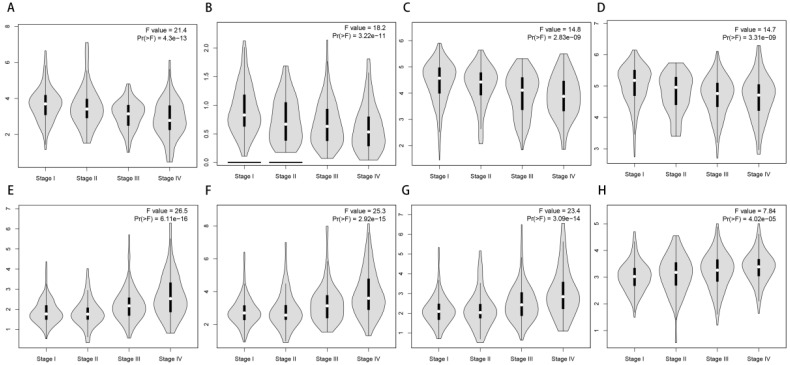
Figure 7.
Correlation of the expression of UPSs with tumor stages. (A-D) 4 representative genes that have negative correlations with tumor stages. They are TRIM2 (A), OTUD7A (B), RCHY1 (C), DCAF11 (D). (E-H) 4 representative genes that have positive correlations with tumor stages. They are CDCA3 (E), UBE2C (F), CDC20 (G), FBXL6 (H).

