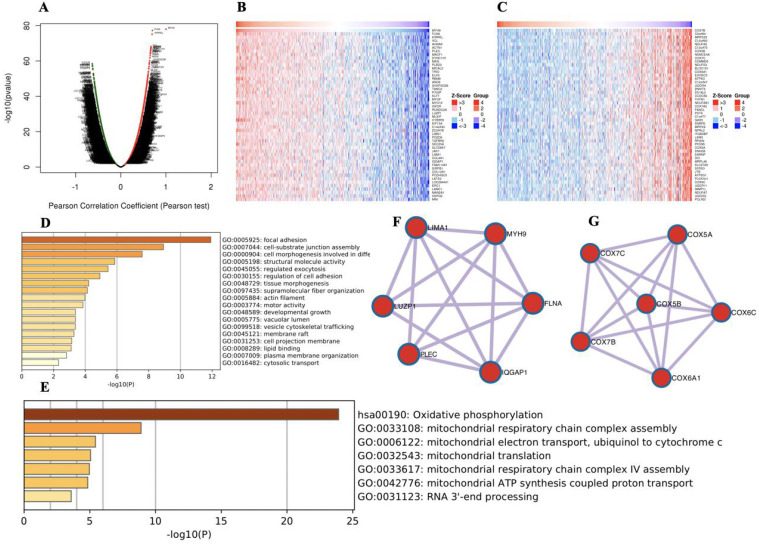
Figure 2.
Genes differentially expressed in correlation with MYH9 in HNSCC. A. A Pearson test was used to analyze correlations between MYH9 and genes expressed in HNSCC. B-C. Heat maps showing genes positively and negatively correlated with MYH9 (TOP 50). Red indicates positively correlated genes and green indicates negatively correlated genes. D-E. The significantly enriched GO annotations and KEGG pathways of MYH9 of top 50 significant gene sets (D) positively and (E) negatively correlated with MYH9. F-G. Network module obtained from the (F) positively and (G) negatively genes protein-protein interaction network.

