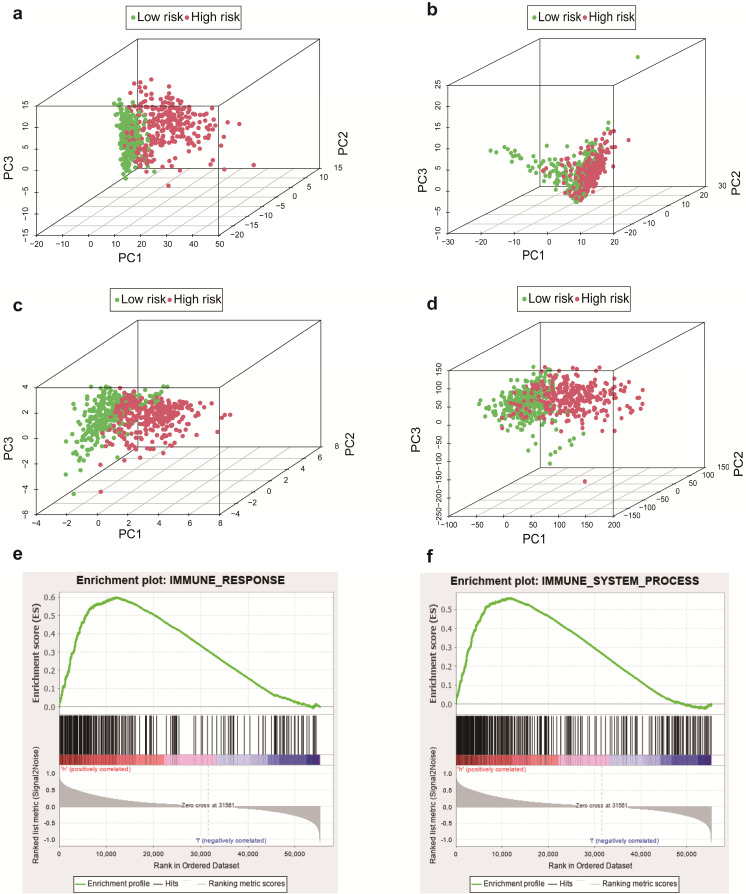
Figure 6.
Principal components analysis (PCA) and Gene set enrichment analysis (GSEA) in entire cohort. The high‐risk group and low‐risk group demonstrated different immune status. PCA between high‐risk group and low‐risk group based on the sIRlncRs gene sets (a), IRlncRs gene sets (b), IRGs sets (c), and all gene sets (d), respectively. The red and green dots represent high-risk and low-risk gene, respectively. GSEA indicated significant enrichment of immune‐related phenotype in the high‐risk group (e and f).

