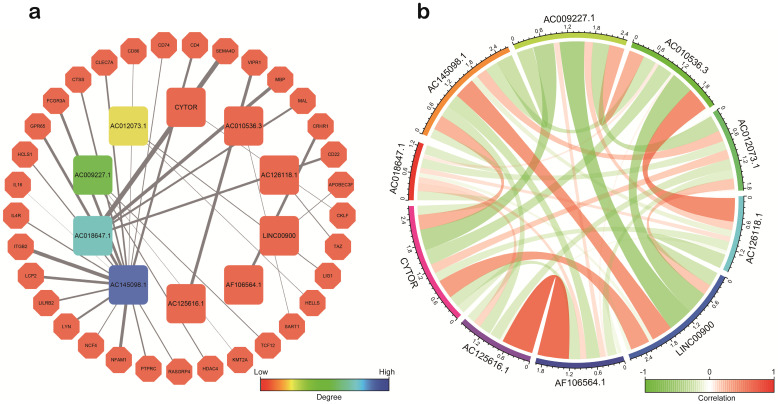
Figure 8.
Correlation analysis of the ten sIRlncRs. a. Correlation of co-expression between sIRlncRs and immune gene at transcriptional level. The polygons represent immune gene, the squares represent sIRlncRs. The edges represent the relationship between sIRlncRs and immune gene. The width is proportional to the degree of correlation. b. Correlation analysis among 10 sIRlncRs. The red bands represent positive correlation, and the green bands show negative correlation. The width of the bands represents the degree of correlation between the sIRlncRs.

