Figure 6.
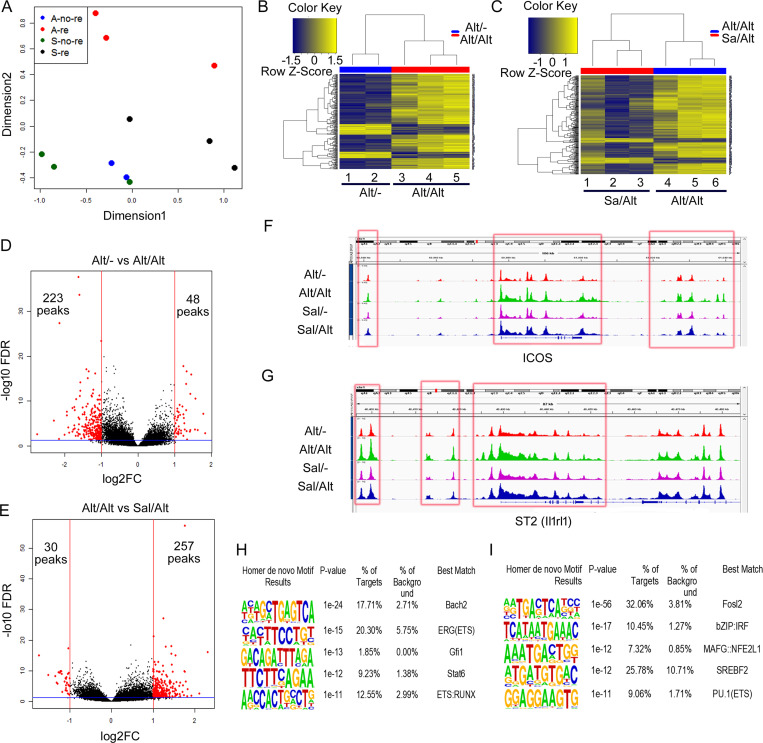
ATAC-seq of lung ILCs (sorted CD45+NK1.1−CD25+ICOS+) from the memory models. As per Fig. 4 A. (A) PCA of ATAC data from the study groups: Alt exposure and no recall (Alt/−), Alt exposure and recall (Alt/Alt), Sal exposure and no recall (Sal/−), and Sal exposure and recall (Sal/Alt). n = 3 for all study groups except Alt/− (n = 2). (B and C) Heatmaps of differentially expressed DNA accessibility peaks between Alt/− versus Sal/− (B) and Alt/Alt versus Sal/Alt (C). (D and E) Volcano plots of differentially expressed DNA accessibility peaks between Alt/− versus Alt/Alt (D) and Alt/Alt versus Sal/Alt (E). FC, fold-change. (F and G) DNA accessibility tracing of two representative genes: Icos (F) and ST2 (il1rl1; G), which were differentially expressed both in ATAC-seq and scRNA-seq. (H and I) Top de novo motifs by HOMER analysis distinguishing Alt/− from Alt/Alt (H) and Alt/Alt from Sal/Alt (I).

