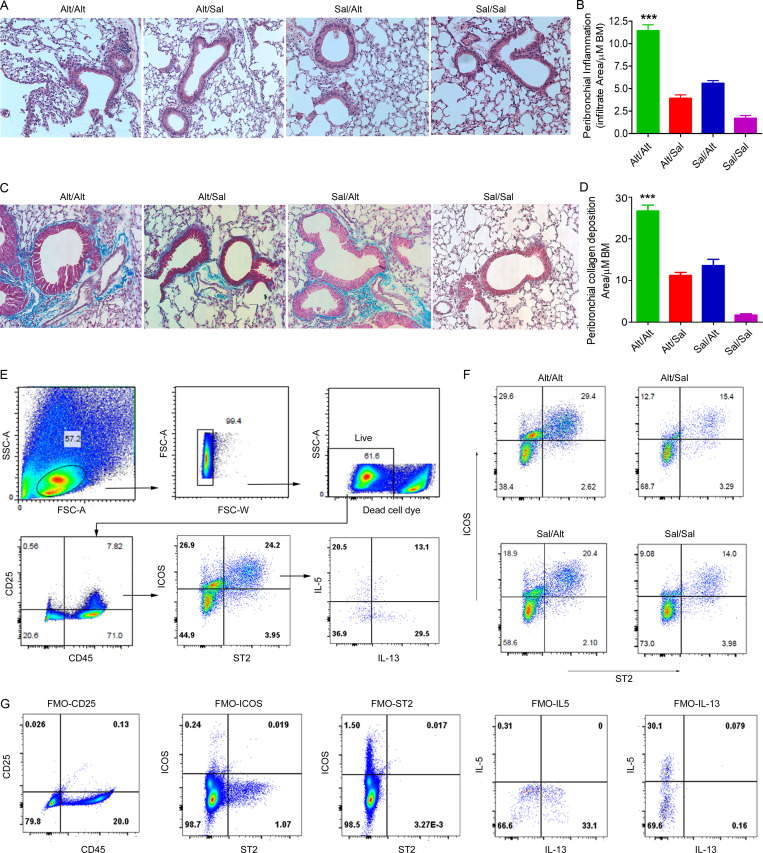
Figure S1.
Representative histological images and gating strategy for flow cytometry. (A–D) Histological changes in the memory model. (A and B) H&E staining and morphometric quantification of the lung tissue from the experimental groups: Sal/Alt, Alt/Sal, Alt/Alt, and Sal/Sal. ***, P < 0.0001. (C and D) Peribronchial collagen deposition and its morphometric quantification from the study groups as described previously (Christianson et al., 2015). ***, P < 0.0001 as compared with other groups, one-way ANOVA, n = 10 per group. Scale bars are 100 µm, and the images were acquired at 20×. BM, bone marrow. (E–G) FCM analysis of lung ILCs from the study groups. Blood-depleted mouse lungs from the study groups were digested with collagenase, and single cells were stained with antibodies against CD45, CD25, ICOS, ST2, IL5, and IL13. Following gating live single cells, they were further gated for CD45+CD25+ cells and then analyzed for ICOS+ST2+, IL5+ICOS+ST2+, and IL13+ICOS+ST2+ cells. (F) Representative flow cytograms showing ICOS+ST2+ cells from the four study groups. (G) Fluorescence minus one (FMO) for the studied molecules used to develop the gating strategy. FSC, forward scatter; SSC, side scatter.

