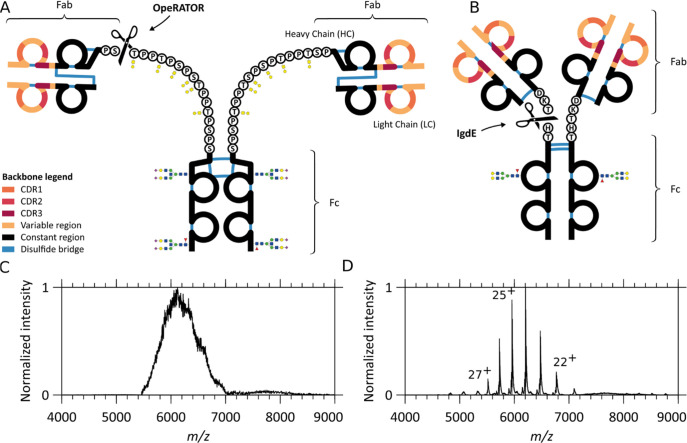
Figure 1.
Schematic overview of similarities and differences in IgA1 and IgG1 and the resulting native mass spectra. Comparison of (A) IgA1 and (B) IgG1 structures: the two variable regions (colored) display three antigen-binding CDRs each and one constant region (black). Notably, although the light and heavy chain are connected by a single disulfide bond in both IgA1 and IgG1, the connectivity is different. CDR-containing Fab fragments of either IgA1s or IgG1s can be separated from the glycosylated constant Fc portion by proteolytic cleavage (scissors). The OpeRATOR enzyme can cleave IgA1 N-terminally of all O-glycosylation sites, producing predominantly Fab molecules terminated by Ser105 on the constant region of the HC (scissors), whereas IgdE cleaves IgG1 at one specific sequence motif. While IgA1’s HCs bind to LCs via a more N-terminal HC cysteine than IgG1’s, they also differ by the number and location of intrachain disulfides: 6 for IgA1s against 4 for IgG1s. The IgA1 hinge region is extended compared to IgG1. Although the O-glycans are here depicted uncapped for simplicity, they can be variably extended by additional Gal and NeuNAc residues. Native MS1 spectra of (C) intact anti-CD20 IgA1 and (D) anti-CD20 IgG1. While baseline-resolved ion signals can be detected for IgG1, the structural heterogeneity of IgA1 leads to charge-unresolved ion signals, hampering direct mass determination.

