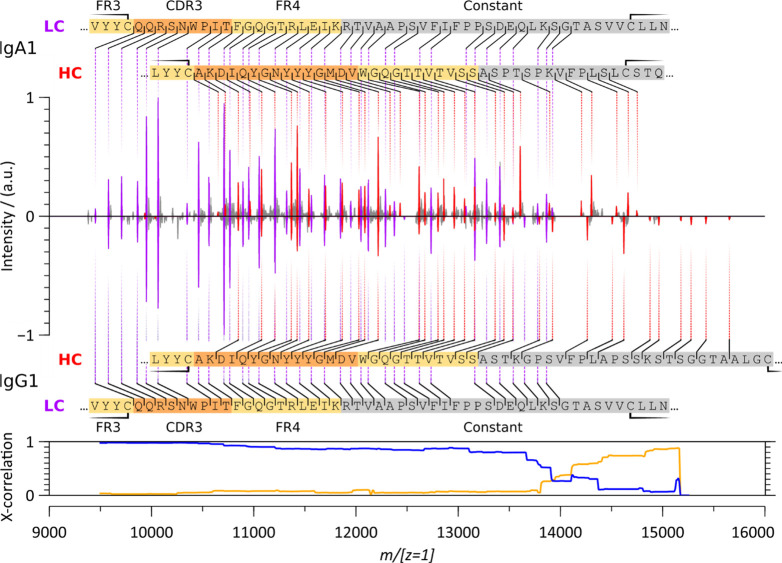
Figure 4.
Charge-deconvoluted native top-down ECD spectra of intact anti-CD20 IgA1 (top) and IgG1 (bottom). LC c-ion fragments are annotated in purple and the HC c-ion fragments in red. Cross-correlation between all fragments shows a very high similarity up to m/[z = 1]14000 (blue). Accounting for the known sequence deviation between the anti-CD20 IgA1 and anti-CD20 IgG1 constant regions, and the corresponding mass shift (IgA.xxxPTSPK – IgG.xxxTKGPS ≡ 40.0313 Da), restores a high cross-correlation above m/[z = 1]14000 (orange line). See also Figure S2.

