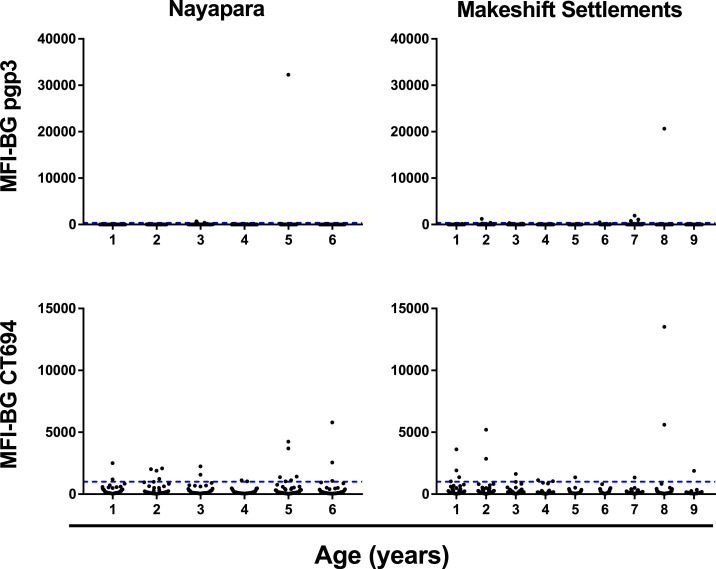
Figure 3.
Intensity of antibody responses to the Chlamydia trachomatis antigens Pgp3 (top) and CT694 (bottom) stratified by age in years up to 6 years for Nayapara Registered Camp (left) and up to 9 years for Makeshift Settlements (right). Each dot represents an individual. Y-axis shows the intensity of the antibody response against each antigen measured in median fluorescence intensity (MFI) with background levels subtracted out (MFI-BG). The upper range of the Y-axis scale differs for each antigen (40,000 for Pgp3 and 15,000 for CT694, and then adjusted to be the same within each antigen to compare the two sites). The dashed blue line shows the seropositivity cutoff. CT = C. trachomatis; Pgp = plasmid gene product. This figure appears in color at www.ajtmh.org.

