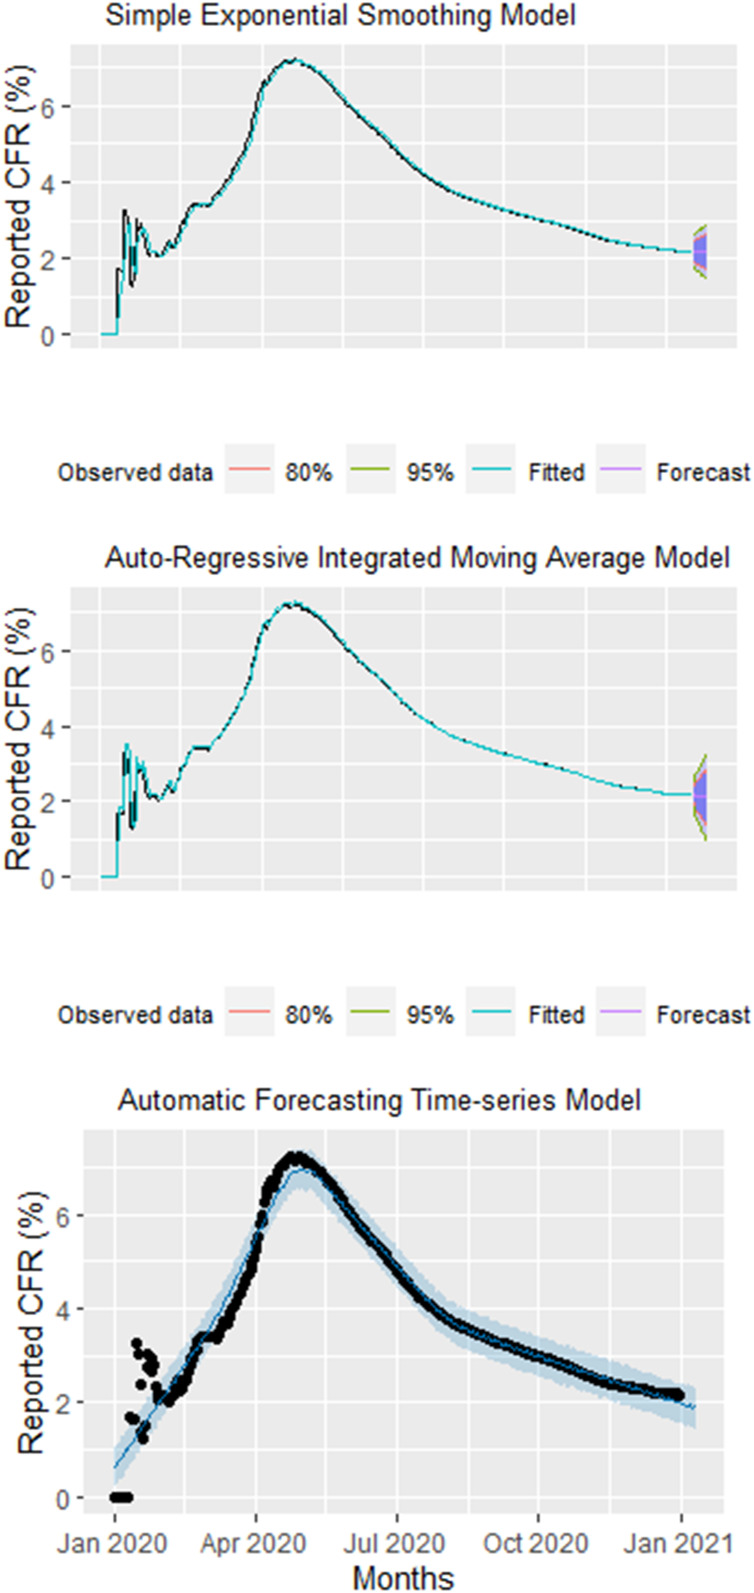
Figure 3.
Top: Observed and predicted daily worldwide daily reported case-fatality rate (rCFR) using a simple exponential smoothing (SES) model. Middle: Observed and predicted daily worldwide daily cumulative rCFR using an auto-regressive integrated moving average (ARIMA) model. Bottom: Observed and predicted daily worldwide daily cumulative rCFR using an automatic forecasting time-series model (Prophet). Black dots = observed data; the blue line = predictive CFR; the shaded area = 95% confidence interval of predicted CFR. This figure appears in color at www.ajtmh.org.

