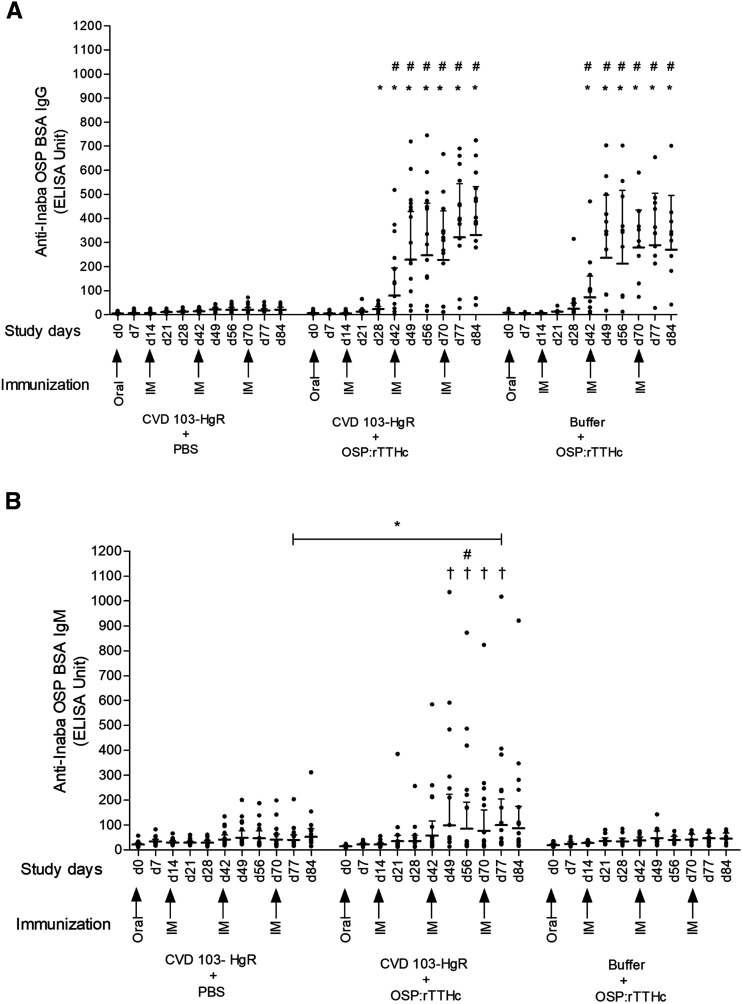
Figure 3.
O-specific polysaccharide (OSP) specific serum responses. Vaccine cohorts are as described in Figure 2. Dots represent responses in individual mice, and horizontal bars represent geometric mean IgG (A) and IgM (B) responses. Error bars represent 95% CIs. We defined a responder as having more than or equal to 100-fold (IgG) and 150-fold (IgM) increase of ELISA units for OSP-specific responses compared with baseline levels (day 0). An asterisk indicates a statistically significant difference from the CVD 103-HgR + PBS group to other vaccine groups (P < 0.05). #, statistically significant differences of responder frequency (see Supplemental Tables 2 and 3) from the CVD 103-HgR + PBS group to CVD 103-HgR + OSP: recombinant tetanus toxoid heavy chain fragment (rTTHc) or Buffer + OSP: rTTHc groups in chi-square (χ2) tests (P < 0.05). † indicates statistically significant difference of responder frequency between the CVD 103-HgR + OSP: rTTHc group to Buffer + OSP: rTTHc group in chi-square (χ2) tests (P < 0.05).

