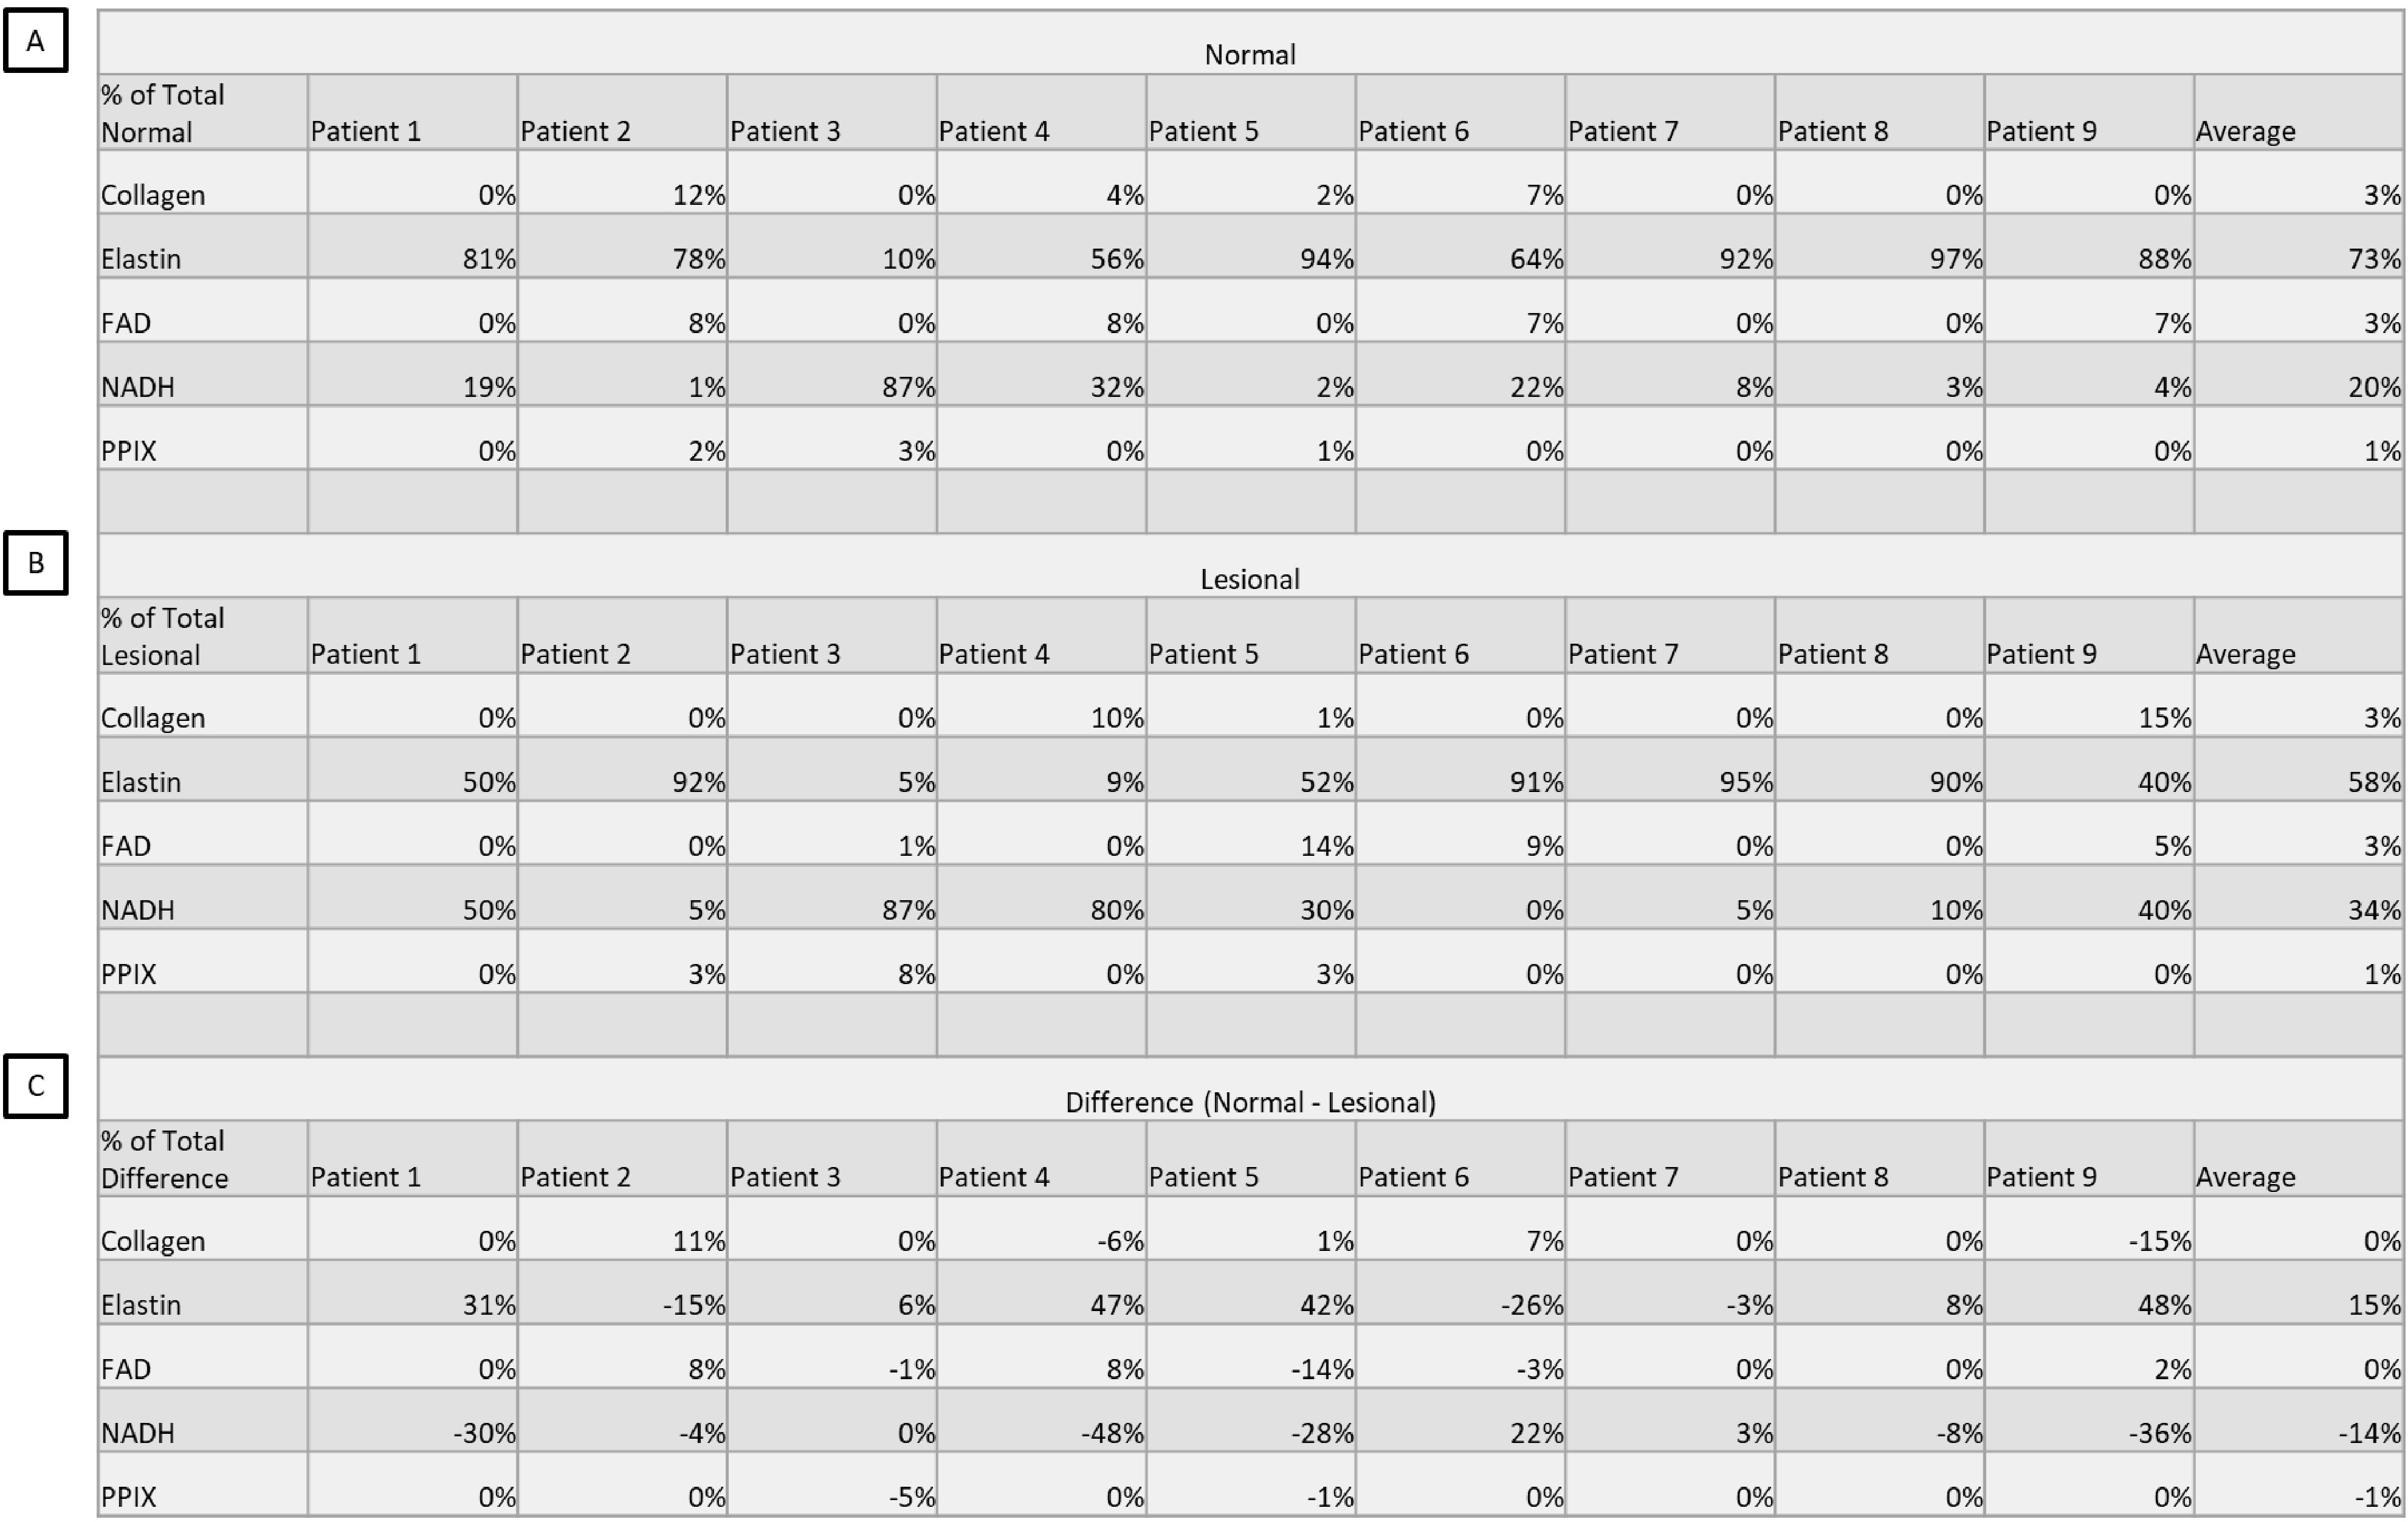
Figure 4.

A comparison of “% of total fluorescence” measurements taken by fluorophore, patient, and pathological classification. Percentages were generated by mean fluorescence intensity measurement of the unmixed image divided by the sum of the fluorescence intensities per image. These percentages were averaged per patient. A) The “% of total fluorescence” measurements of the non-lesional tissue regions averaged per patient per fluorophore. B) The “% of total fluorescence” measurements of the lesional tissue regions averaged per patient per fluorophore. C) The difference in non-lesional and lesional averages per patient per fluorophore, calculated by subtracting (A)-(B). Percentage values were rounded post calculation from original intensity measurements.
