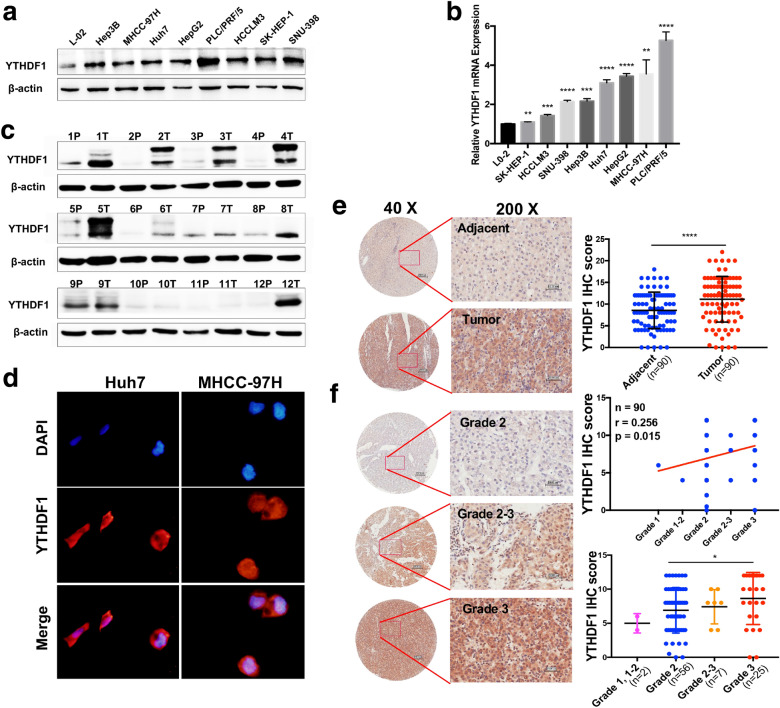
Fig. 2.
YTHDF1 was overexpressed in HCC and was associated with tumor grade. A The protein level of YTHDF1 detected by western blot and B the mRNA level of YTHDF1 detected by q-RT PCR in a normal liver cell and 8 different HCC cell lines. C The protein level of YTHDF1 was detected by western blot in 12 paired HCC tissues marked by T and adjacent nontumorous tissues marked by P. D The subcellular location of YTHDF1 was examined by immunofluorescence assay. E Representative immunohistochemical (IHC) staining images of YTHDF1 expression in 90 HCC tissues and paired adjacent nontumorous tissues (F) or in different grades of HCC tissues, conducted by tissue microarrays. Scatter plot analysis and clinicopathological correlation analysis of YTHDF1 IHC score in HCC tissues and nontumorous tissues were performed. Scale bar, 200 μm (40X) and 50 μm (200X). *P < 0.05, **P < 0.01, ***P < 0.001, ****P < 0.0001

