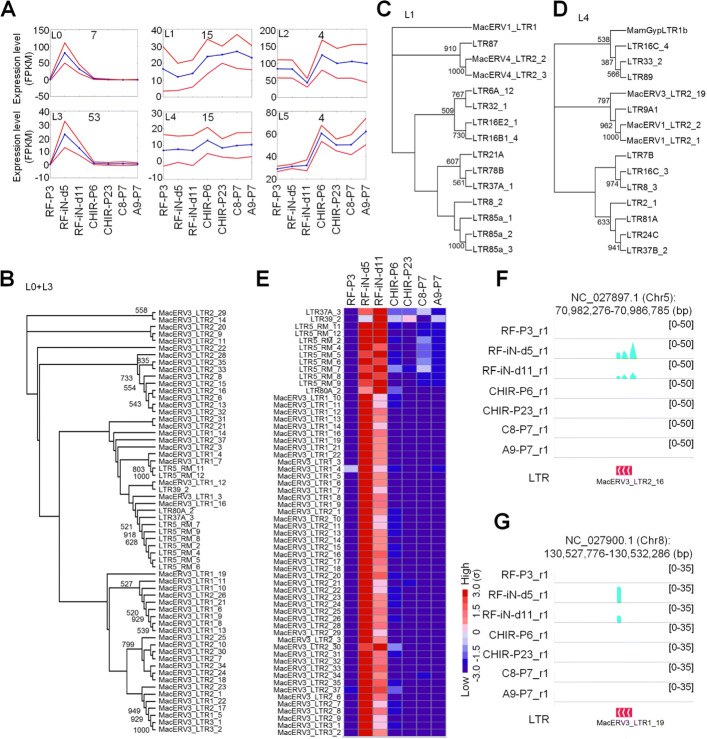
Fig. 3.
The clusters of LTRs with different expression patterns during the reprogramming of fibroblast cells in Macaca mulatta. In Part (B) to (D), the numbers in the trees are bootstrap values greater than 500 (50%). (A) The clusters of LTRs and their expression patterns at different stages of reprogramming. Blue lines indicate the average expression levels of genes in the cluster in different cell lines. Red lines indicate average expressions plus/minus standard deviations. (B) The phylogenetic tree of LTRs in the Clusters L0 and L3 of Part (A). (C) The phylogenetic tree of LTRs in the Cluster L1 in Part (A). (D) The phylogenetic tree of LTRs in the Cluster L4 in Part (A). (E) The expression levels of LTRs in the Clusters L0 and L3 of Part (A). (F) - (G) The expressions of two solo LTRs in the 7 cell lines. One of the two replicated RNA-Seq profiles for each lines were shown

