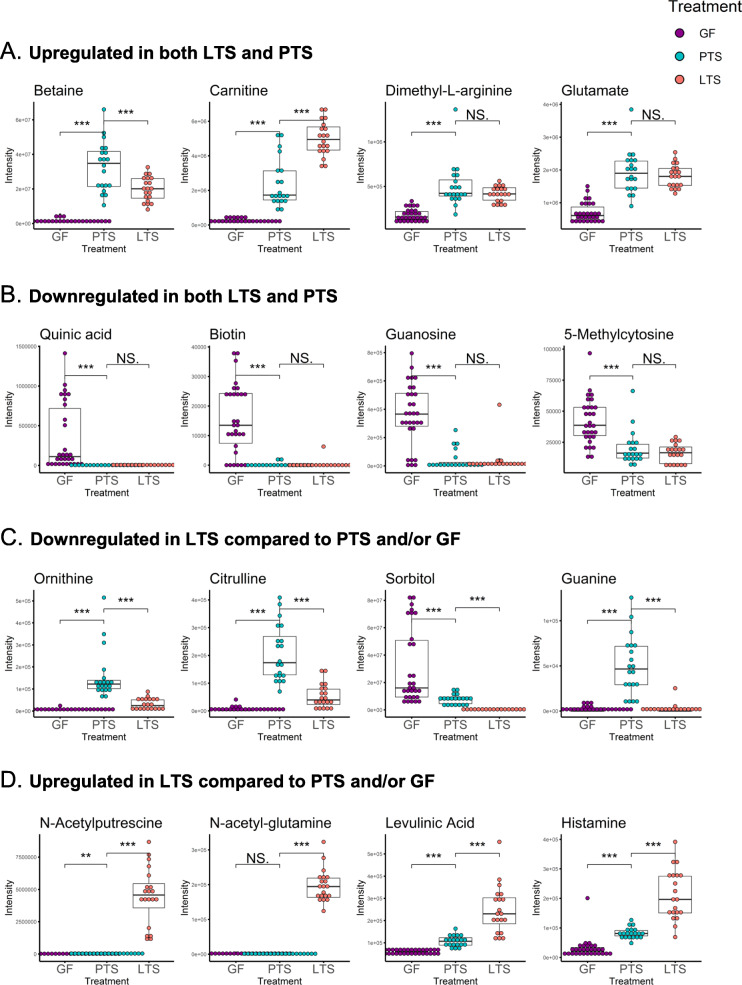
Fig. 4.
Patterns of regulation of identified metabolites in GF, PTS and LTS mice. a Box-whisker plots of representative upregulated metabolites in LTS and PTS mice compared to GF. b Box-whisker plots of representative downregulated metabolites in LTS and PTS mice compared to GF. c Box-whisker plots of representative downregulated metabolites in LTS compared to PTS and/or GF mice. d Box-whisker plots of representative upregulated metabolites in LTS compared to PTS and/or GF mice. * P < 0.05; ** P < 0.025; *** P < 0.001; NS = not significant, P > 0.05

