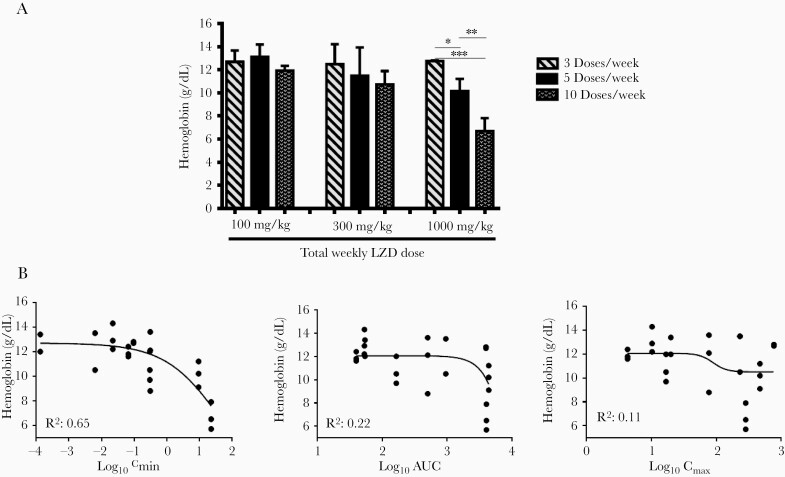
Figure 4.
Exposure-response relationship for linezolid (LZD)-induced anemia, as measured by hemoglobin in infected BALB/c mice. (A) Mean hemoglobin by total weekly dose and dosing frequency. (B) Relationships between pharmacokinetic/toxicodynamic parameters and hemoglobin. Three total weekly LZD doses (0, 100, 300, and 1000 mg/kg per week) were fractionated into 3 dosing schedules: 3 doses/week, 5 doses/week, and 10 doses/week. Statistical significance determined using one-way analysis of variance with Tukey’s posttest to adjust for multiple comparisons within each dose level: *, P < .05; **, P < .01; ***, P < .001. AUC, area under the concentration-time curve; Cmax, LZD maximum concentration; Cmin, LZD minimum concentration.

