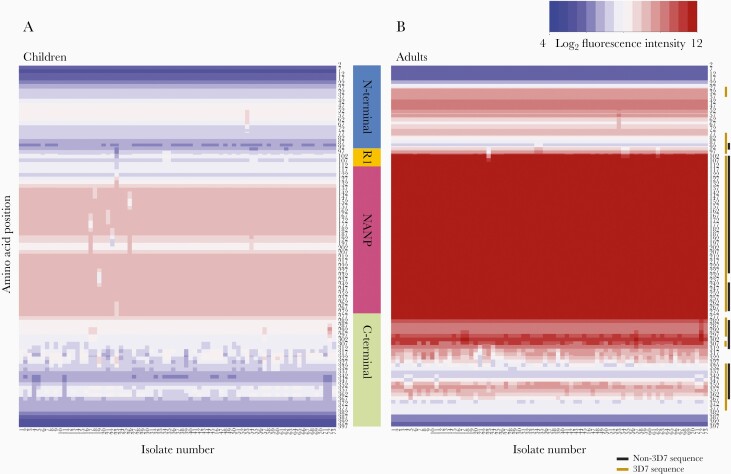
Figure 2.
Heatmaps of the median seroreactivity of Malian adults and children before the start of a malaria season. Each column (x-axis) represents the median seroreactivity of all children (A) or adults (B) for each of the 73 CSP haplotypes; each row (y-axis) represents a position along the protein sequence. Adults showed greater median seroreactivity than children, especially to R1 and the central repeat region (P < .05 with BH correction). The gold line next to the heat map shows where seroreactivity to the 3D7 sequence was significantly higher in adults compared to children, and the black line represents areas where seroreactivity to non-3D7 sequences was significantly higher in adults compared to children.

