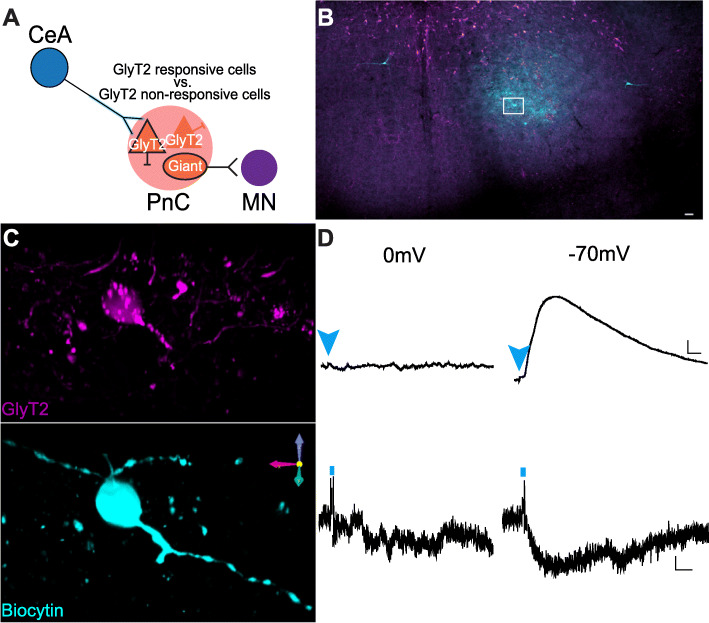
Fig. 9.
Electrophysiological properties of GlyT2+ PnC neurons. a Schematic of the hypothesis being tested. b Representative PnC slice showing eGFP+ fluorescence (magenta) and Biocytin staining (cyan). c Higher magnification of the box area in a, showing representative morphological reconstructions of recorded GlyT2+ cell bodies filled with biocytin. d Representative light-evoked voltage (top two traces) and current traces (bottom two traces) recorded at 0 mV (left) and − 70 mV (right) of a GlyT2+ neuron responsive to blue light. Blue arrowheads and short vertical lines indicate blue light photo-stimulation. Representative of N = 10 mice, n = 38 neurons. Scale bars: b 250 μm. c 10 μm. d Voltage traces: 1 mV/10 ms; Current traces: 5 pA/1 ms

