Fig. 1.
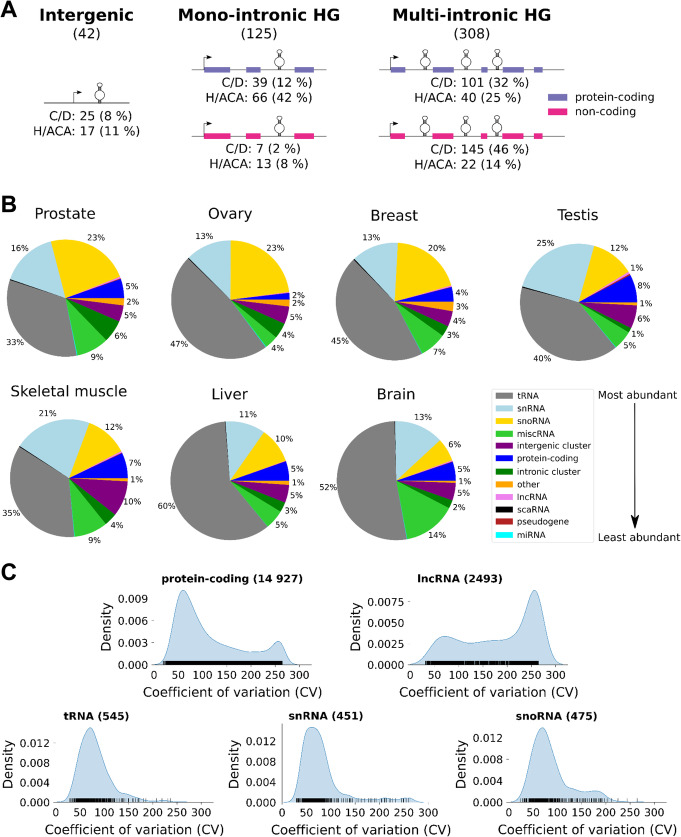
SnoRNAs are among the most abundant RNAs in the cell. A SnoRNAs are expressed from various genomic contexts. Shown is a schematic representation of the three most common classes of human snoRNA genomic contexts. Intergenic, mono-intronic HG, and multi-intronic HG indicate respectively snoRNAs expressed as independent genes, host genes that encode a single snoRNA in one of their introns and host genes that encode multiple snoRNAs each in a separate intron. Protein-coding and non-coding host genes are indicated in purple and magenta respectively. The total number of expressed snoRNAs in each context is indicated under each title. The number and proportion of box C/D and H/ACA snoRNAs in each context are indicated under each schematic representation. The percentages are calculated for C/D and H/ACA box snoRNAs separately. B The highest relative abundance of snoRNAs is detected in prostate and female reproductive tissues. The RNA was sequenced using TGIRT-Seq from three replicates per tissue and the distribution of the average total abundance (in transcript per million (TPM)) per RNA biotype for each considered tissue is illustrated in the form of pie charts. Only RNAs with an abundance greater than 1 TPM in at least one tissue sample are considered. The color legend for the RNA biotype is shown on the far right, with an arrow representing the average ranking of RNA biotype abundance across tissues. C The abundance of snoRNAs is at the interface between regulatory RNAs and housekeeping RNAs. The distribution of snoRNA coefficient of variation (CV) was compared to that of the main classes of regulatory RNAs (protein-coding RNA and lncRNA) and housekeeping RNAs (tRNA and snRNA). The CV of each RNA is indicated by a vertical black line above the x-axis. The number of expressed RNAs considered in the density plots is indicated between parentheses on top of the graphs

