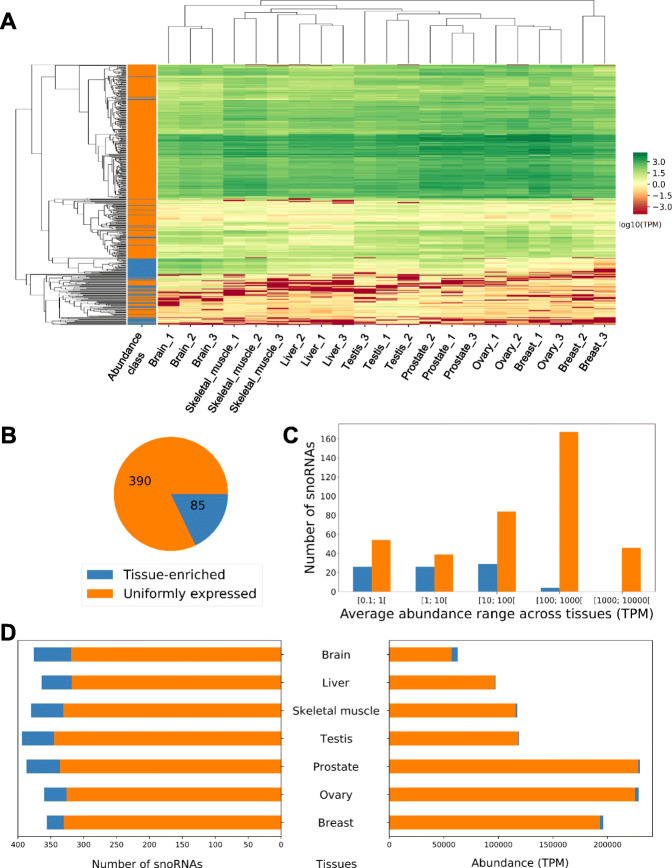
Fig. 2.
RNA abundance divides snoRNAs into two classes with distinct tissue distribution. A SnoRNA abundance accurately clusters healthy human tissues. The heatmap indicates the abundance level of the expressed snoRNAs in 21 RNA samples from 7 different human tissues (legend for the abundance class color bar on the left is shown in B). Only snoRNAs with an abundance greater than 1 TPM in at least one sample are considered. The color scale for the abundance is shown on the right. B SnoRNAs are divided into two abundance classes. The number of snoRNAs in the uniformly expressed and tissue-enriched classes is shown in the form of a pie chart. C Most tissue-enriched snoRNAs are less abundant than their uniformly expressed counterparts. The bar chart indicates the number of both tissue-enriched and uniformly expressed snoRNAs in the different ranges of average RNA abundance across tissues. D Most tissue-enriched snoRNAs are expressed in the brain. The number of uniformly expressed and tissue-enriched snoRNAs with an abundance of at least 1 TPM in the examined tissues is displayed on the left, while the total RNA abundance of each class of snoRNAs detected in the different tissues is shown on the right.

