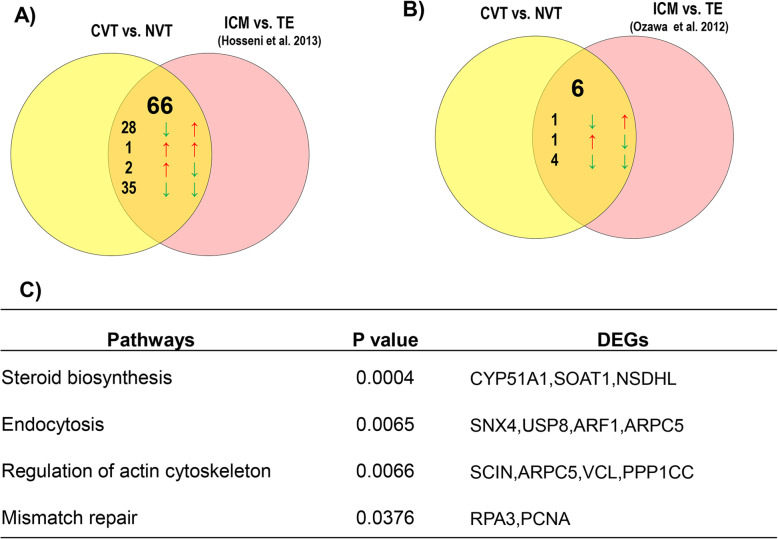
Fig. 9.
Meta-analysis of genes predictive for developmental capacity of in vitro derived embryos and differential expressed between ICM and TE cells. a Venn diagram depicting genes differentially expressed in CVT vs. NVT as well as in ICM vs. TE cells of in vivo derived embryos. The arrows on the left indicate expression trend of genes in CVT compared to NVT blastocysts whereas the arrows on the right side indicate expression trend of these genes in ICM relative to TE cells of in vivo derived embryos. b Venn diagram depicting genes differentially expressed in CVT vs. NVT as well as in ICM vs. TE cells of in vitro derived embryos. The arrows on the left indicate expression trend of genes in CVT compared to NVT blastocysts whereas the arrows on the right side indicate expression trend of these genes in ICM relative to TE cells of in vitro derived embryos. c Molecular pathways enriched by genes differentially expressed both in CVT vs. NVT blastocysts and as in ICM vs. TE cells

