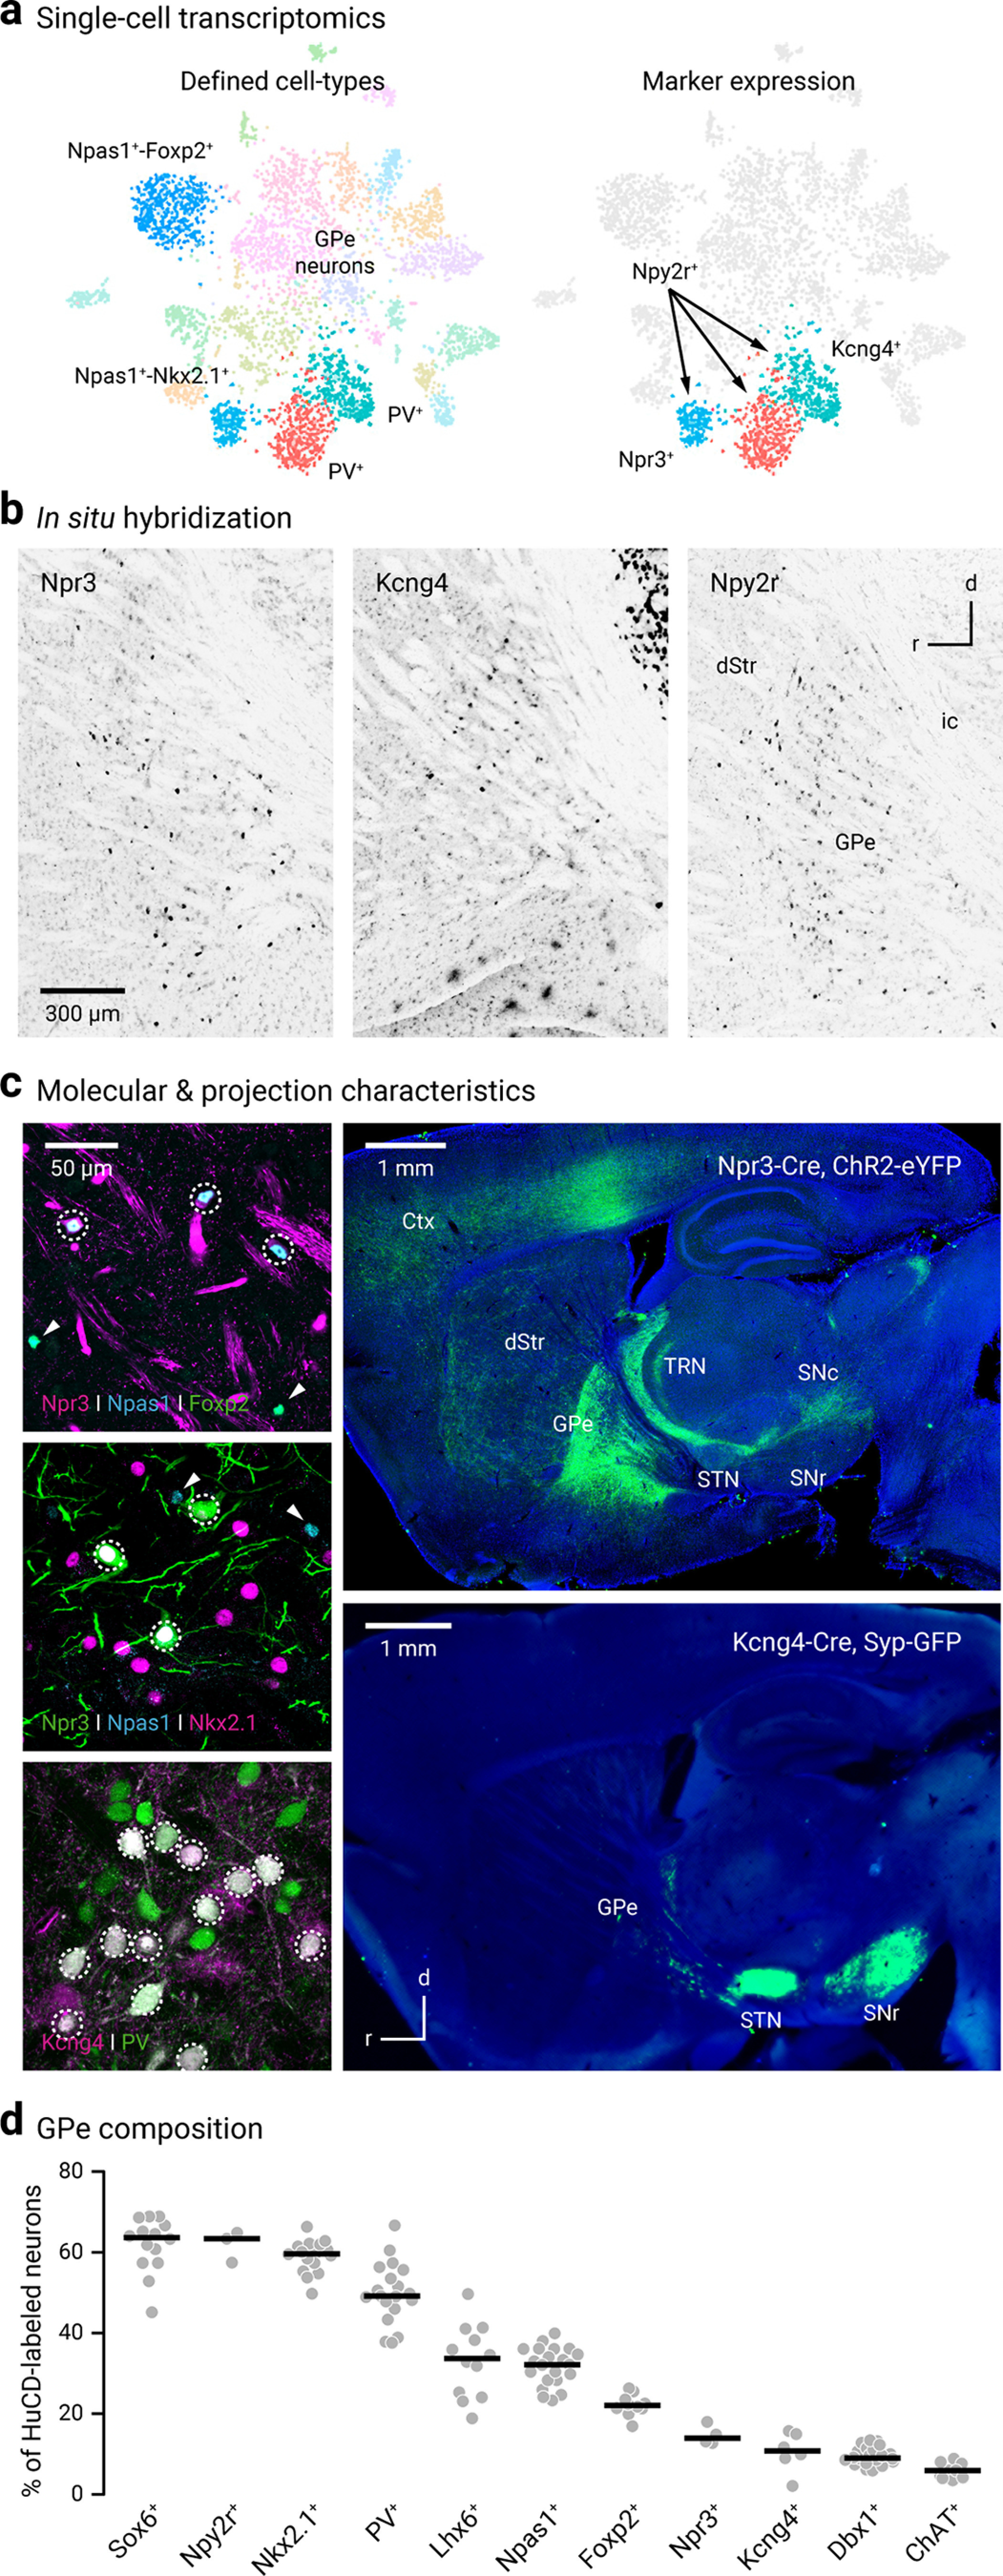
Figure 1.

Novel markers and driver lines for interrogating GPe neurons. a, Left, Single-cell transcriptomic data identified four distinct clusters of GPe neurons; these include Npas1+-Foxp2+ (blue, 10 o'clock), Npas1+-Nkx2.1+ (cyan, 7 o'clock), and two subpopulations of PV+ neurons (red and teal, 6 o'clock). Right, Npy2r is expressed in all non-Npas1+-Foxp2+ neurons; Npr3 and Kcng4 are expressed in a select subset of Npas1+ neurons and PV+ neurons, respectively. Adapted from Saunders et al. (2018). Original expression data can be viewed at http://dropviz.org/?_state_id_=6c13807c8420bc74. b, Sagittal brain sections showing the in situ hybridization signals for Npr3 (left), Kcng4 (middle), and Npy2r (right) in the external globus pallidus (GPe) and neighboring areas. Data were adapted from Allen Brain Atlas. Brightness and contrast were adjusted. Raw data can be viewed and downloaded from http://mouse.brain-map.org. dStr, dorsal striatum; ic, internal capsule. c, Top left, Coexpression (dotted circle) of Npas1 (blue) but not Foxp2 (green) in Npr3+ neurons (magenta). Npas1+-Foxp2+ (and non-Npr3+) neurons were visible in the same field (arrowheads). Middle left, Coexpression (dotted circle) of Npas1 (blue) and Nkx2.1 (magenta) in Npr3+ neurons (green). Npas1+ neurons that were neither Nkx2.1+ nor Npr3+ were visible in the same field (arrowheads). Bottom left, Coexpression (dotted circle) of PV (green) in Kcng4+ neurons (magenta). Top right, Npr3+ neurons share axonal projection patterns similar to that of Npas1+-Nkx2.1+; strong axonal projections to the cortex (Ctx), thalamic reticular nucleus (TRN), and substantia nigra pars compacta (SNc) were evident. Projections were assessed using viral delivery of ChR2-eYFP. Bottom right, Virally delivered synaptophysin-GFP in Kcng4-Cre mice revealed near-exclusive axonal projection from the GPe to the subthalamic nucleus (STN) and substantia nigra pars reticulata (SNr). d, Using HuCD as a neuronal marker, population data for the relative abundance of GPe neuron markers were determined. Each circle represents a section. Medians and sample sizes are as follows: Sox6+ (63.7%, 14), Npy2r+ (63.4%, 3), Nkx2.1+ (59.6%, 16), PV+ (49.2%, 19), Lhx6+ (33.7%, 12), Npas1+ (32.2%, 21), Foxp2+ (22.1%, 10), Npr3+ (14.0%, 4), Kcng4+ (10.8%, 6), Dbx1+ (9.0%, 22), ChAT+ (5.9%, 9). Data are ranked based on the median values as denoted by the thick lines. Parts of the data have been previously published.
