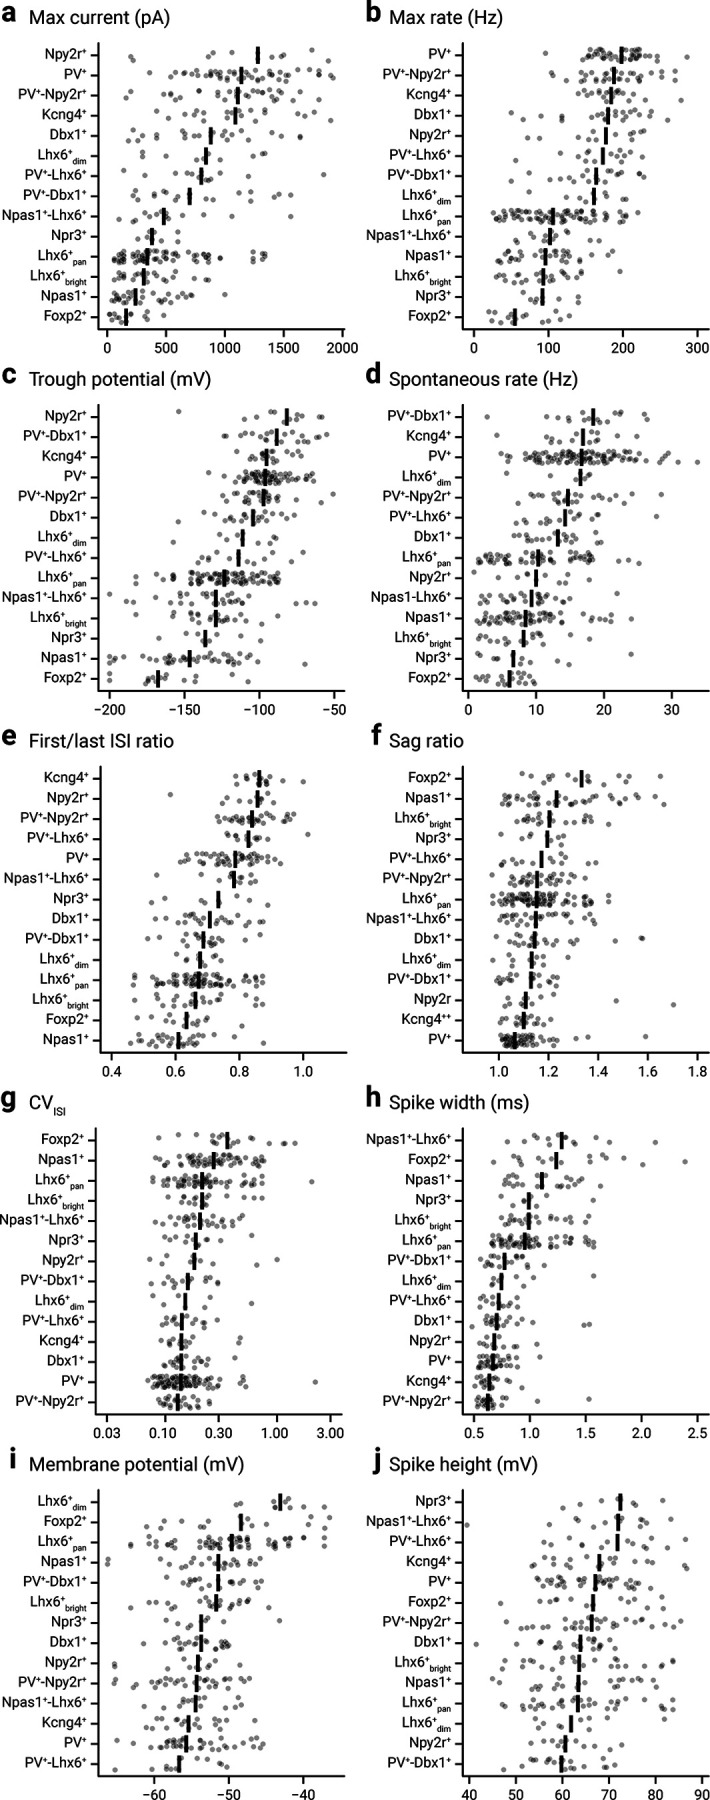
Figure 3.

GPe neurons display graded electrophysiology attributes. Scatter plot summary of the electrophysiological properties of identified GPe neuron subtypes. Max current (a), max rate (b), trough potential (c), spontaneous rate (d), first/last ISI ratio (e), sag ratio (f), CVISI (g), spike width (h), membrane potential (i), and spike height (j) are shown. See Tables 2 and 3 for a listing of median values, sample sizes, and statistical analysis of new neuron types, compared with our recent publication (Abecassis et al., 2020), along with PV+ neurons and Npas1+ neurons for comparison. The data are ordered according to their median value as indicated by the thick vertical lines. Each cell is shown as a circle. A total of 329 neurons were included (n = Dbx1+: 24, Foxp2+: 16, Kcng4+: 20, Lhx6+bright: 24, Lhx6+dim: 10, Lhx6+pan: 68, Npas1+: 24, Npas1+-Lhx6+: 14, Npr3+: 9, Npy2r+: 12, PV+: 41, PV+-Dbx1+: 21, PV+-Lhx6+: 14, PV+-Npy2r+: 32) in this analysis. The complete dataset for electrophysiological measurements of the intrinsic properties and an interactive web tool can be found online (https://icbi-georgetown.shinyapps.io/Neuro_interactive_analysis/). CV, coefficient of variation; ISI, interspike interval.
