Figure 4.

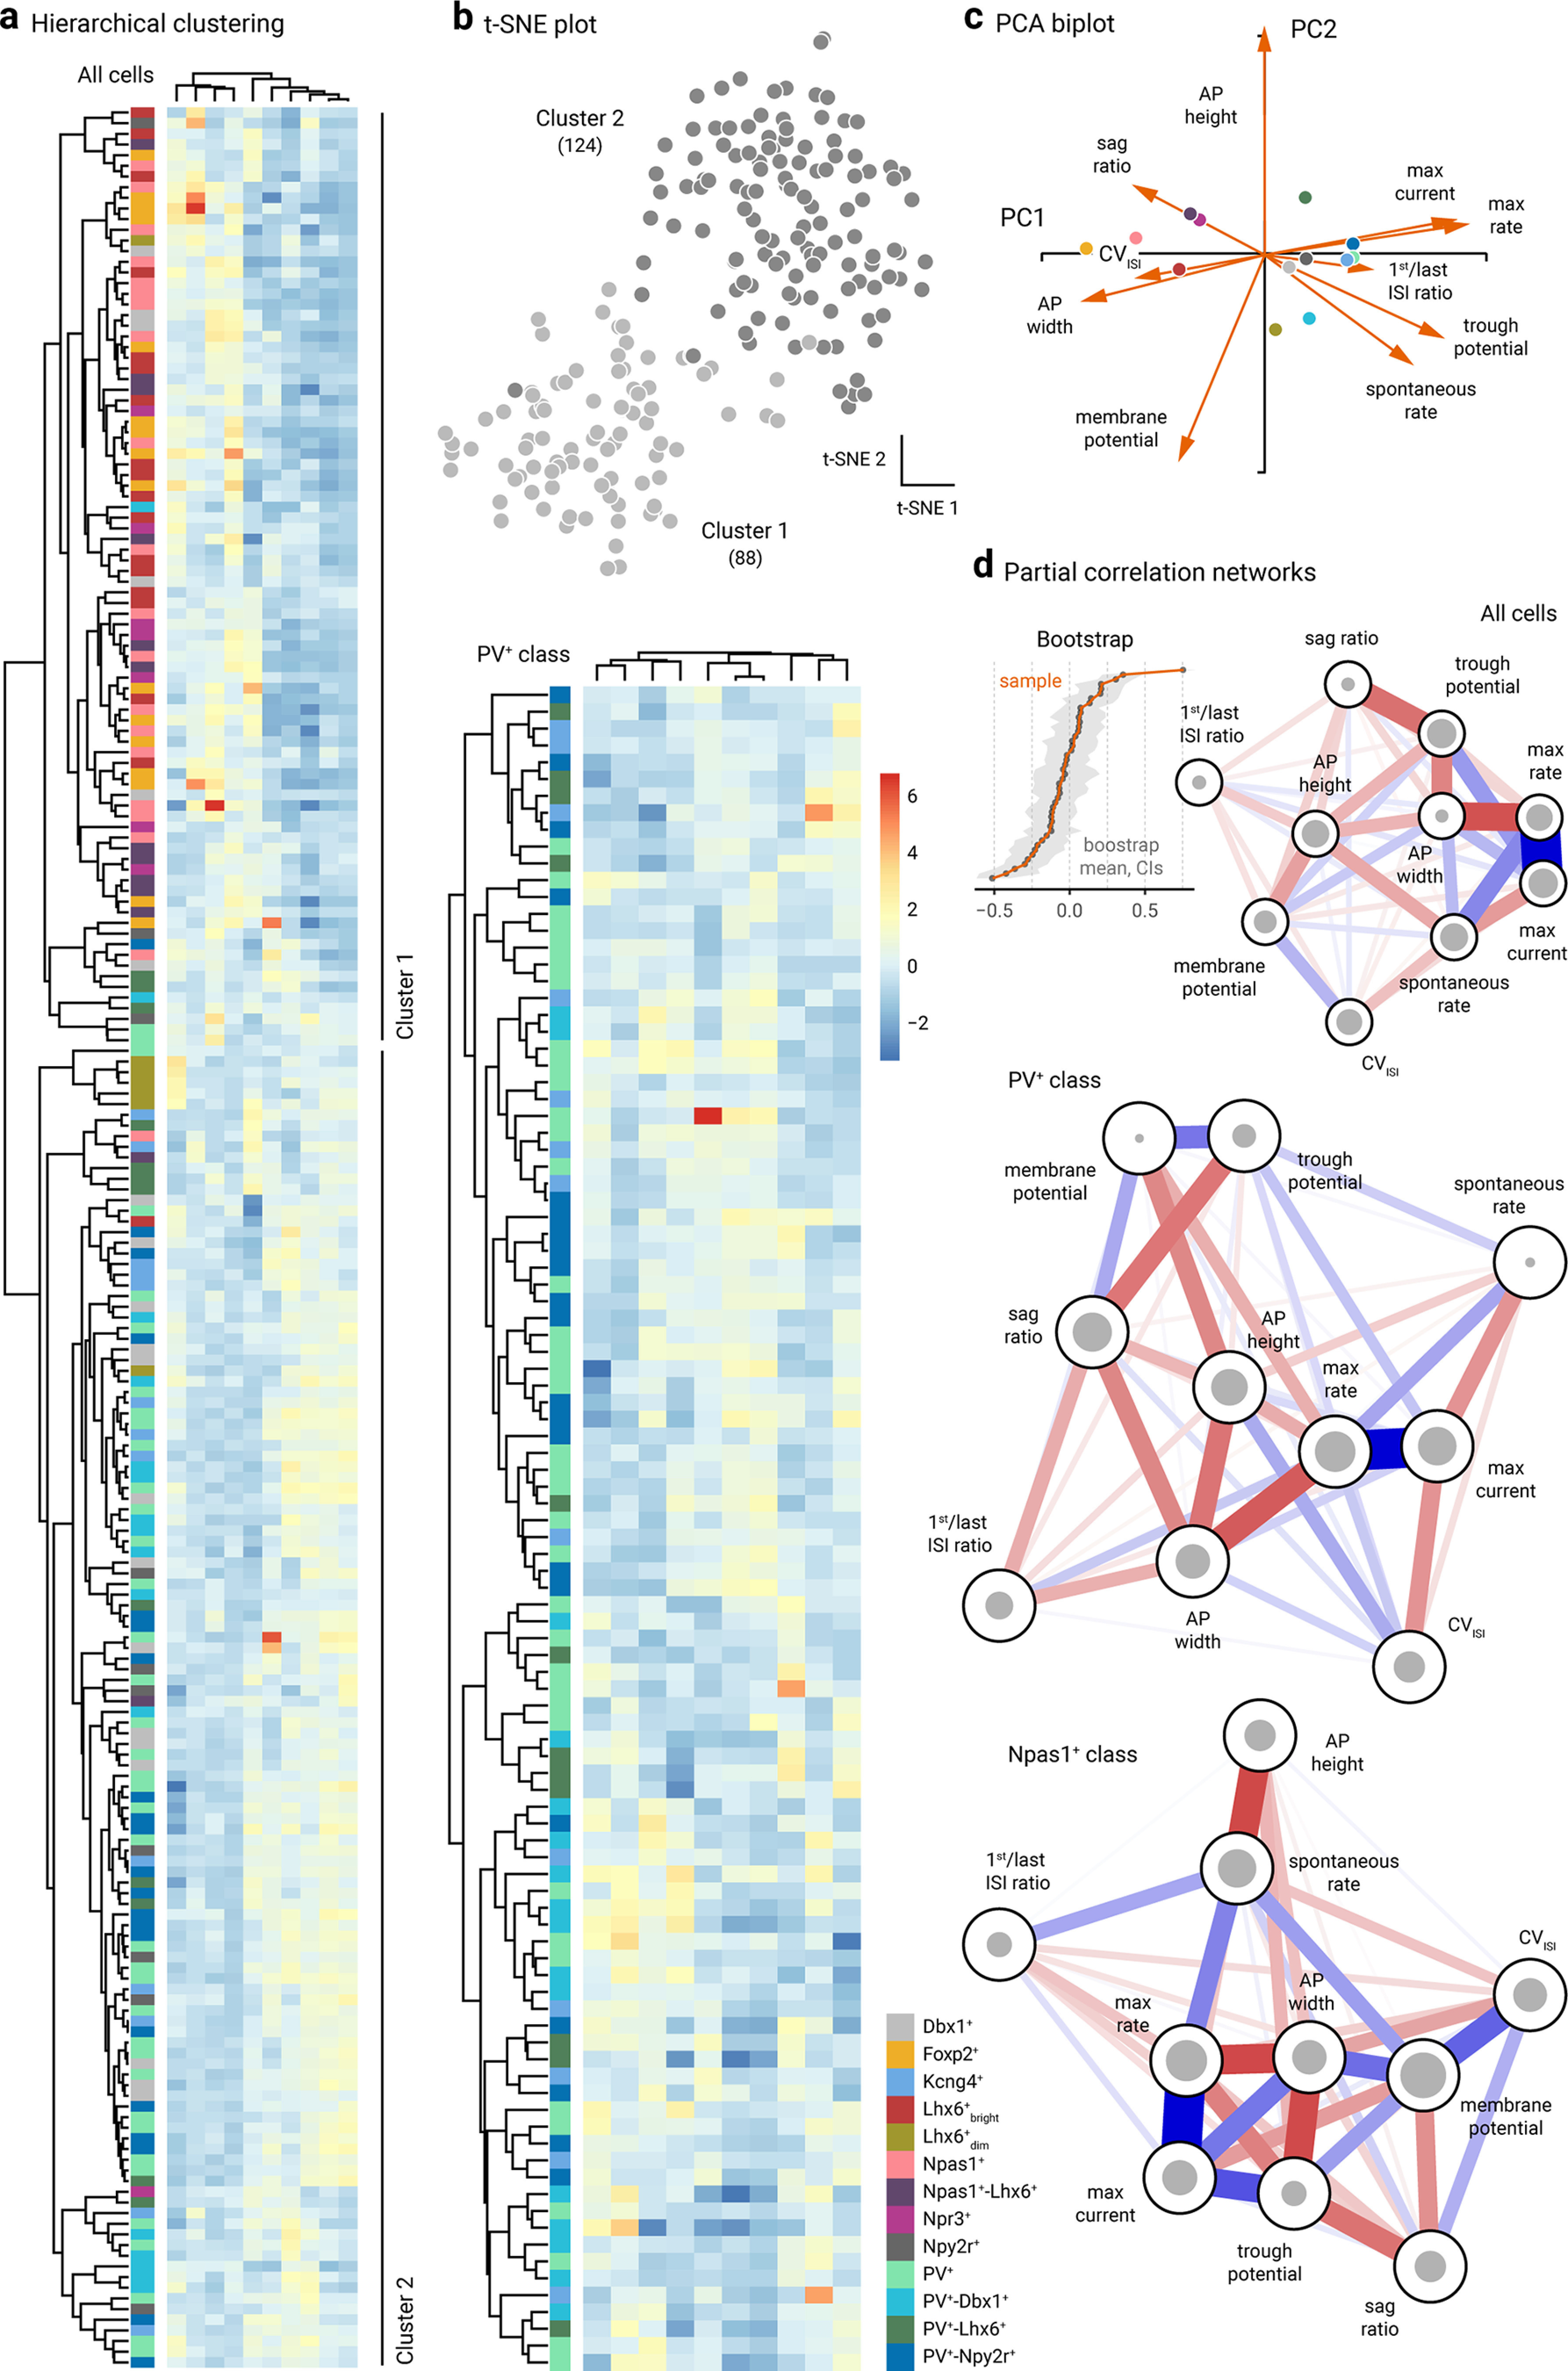
Clustering and network analysis of electrophysiological attributes. a, Left, Heatmap representation of electrical signatures of genetically-identified GPe neuron subtypes. Dendrograms represent the order and distances of neuron clusters and their electrical characteristics. A total of 212 neurons (n = Dbx1+: 20, Foxp2+: 16, Kcng4+: 13, Lhx6+bright: 18, Lhx6+dim: 7, PV+: 38, PV+-Dbx1+: 16, PV+-Lhx6+: 12, PV+-Npy2r+: 21, Npas1+: 19, Npas1+-Lhx6+: 13, Npr3+: 8, Npy2r+: 10) were included in this analysis. Neurons with incomplete data were excluded from the analysis. Two main clusters were identified: Cluster 1 contains 87 cells; Cluster 2 contains 125 cells. Column labels (left to right): membrane potential, CVISI, sag ratio, spike width, spike height, first/last ISI ratio, basal activity, trough potential, max rate, and max current. Right, Genetically-defined PV+ neurons are re-clustered. Scale bar applies to both panels. Purple-red-yellow represents Npas1+ neurons. Blue-green represents for PV+ neurons. Gray represents mixed neuron types (i.e., Dbx1+ and Npy2r+). Column labels (left to right): membrane potential, spike width, basal activity, trough potential, first/last ISI ratio, max rate, max current, sag ratio, CVISI, and spike height. b, t-SNE analysis of the same dataset as in a yielded two distinct clusters: Cluster 1 (light gray) contains 88 cells; Cluster 2 (dark gray) contains 124 cells. The membership assignment in Clusters 1 and 2 for each neuron subtypes is as follows: Foxp2+ (100.0%, 0.0%), Npas1+ (95.2%, 4.8%), Lhx6+bright (94.4%, 5.6%), Npr3+ (87.5%, 12.5%), Dbx1+ (30.0%, 70.0%), Npy2r+ (30.0%, 70.0%), PV+-Lhx6+ (25.0%, 75.0%), Lhx6+dim (14.3%, 85.7%), PV+-Dbx1+ (12.5%, 87.5%), PV+ (5.3%, 94.7%), PV+-Npy2r+ (4.8%, 95.2%), and Kcng4+ (0.0%, 100.0%). c, Principal component biplot showing the relative contributions of each electrophysiological attribute to PC1 and PC2. Markers represent the centroids for each cell type. The length of each vector is proportional to its variance with the cosine of the angle made by the vector with each axis indicating its contribution to that principal component. Highly correlated variables have similar directions; uncorrelated variables are perpendicular to each other. AP, action potential. d, Partial correlation networks with a spring layout from all cells (top), PV+ neurons (middle), and Npas1+ neurons (bottom). Inset, Bootstrap of edge stability. The size of the gray circles indicates the connectivity of nodes to each other as measured by closeness centrality index. Edge thickness indicates the strength of correlation between nodes. Colors represent the polarity of correlations. Blue represents positive correlations. Red represents negative correlations.
