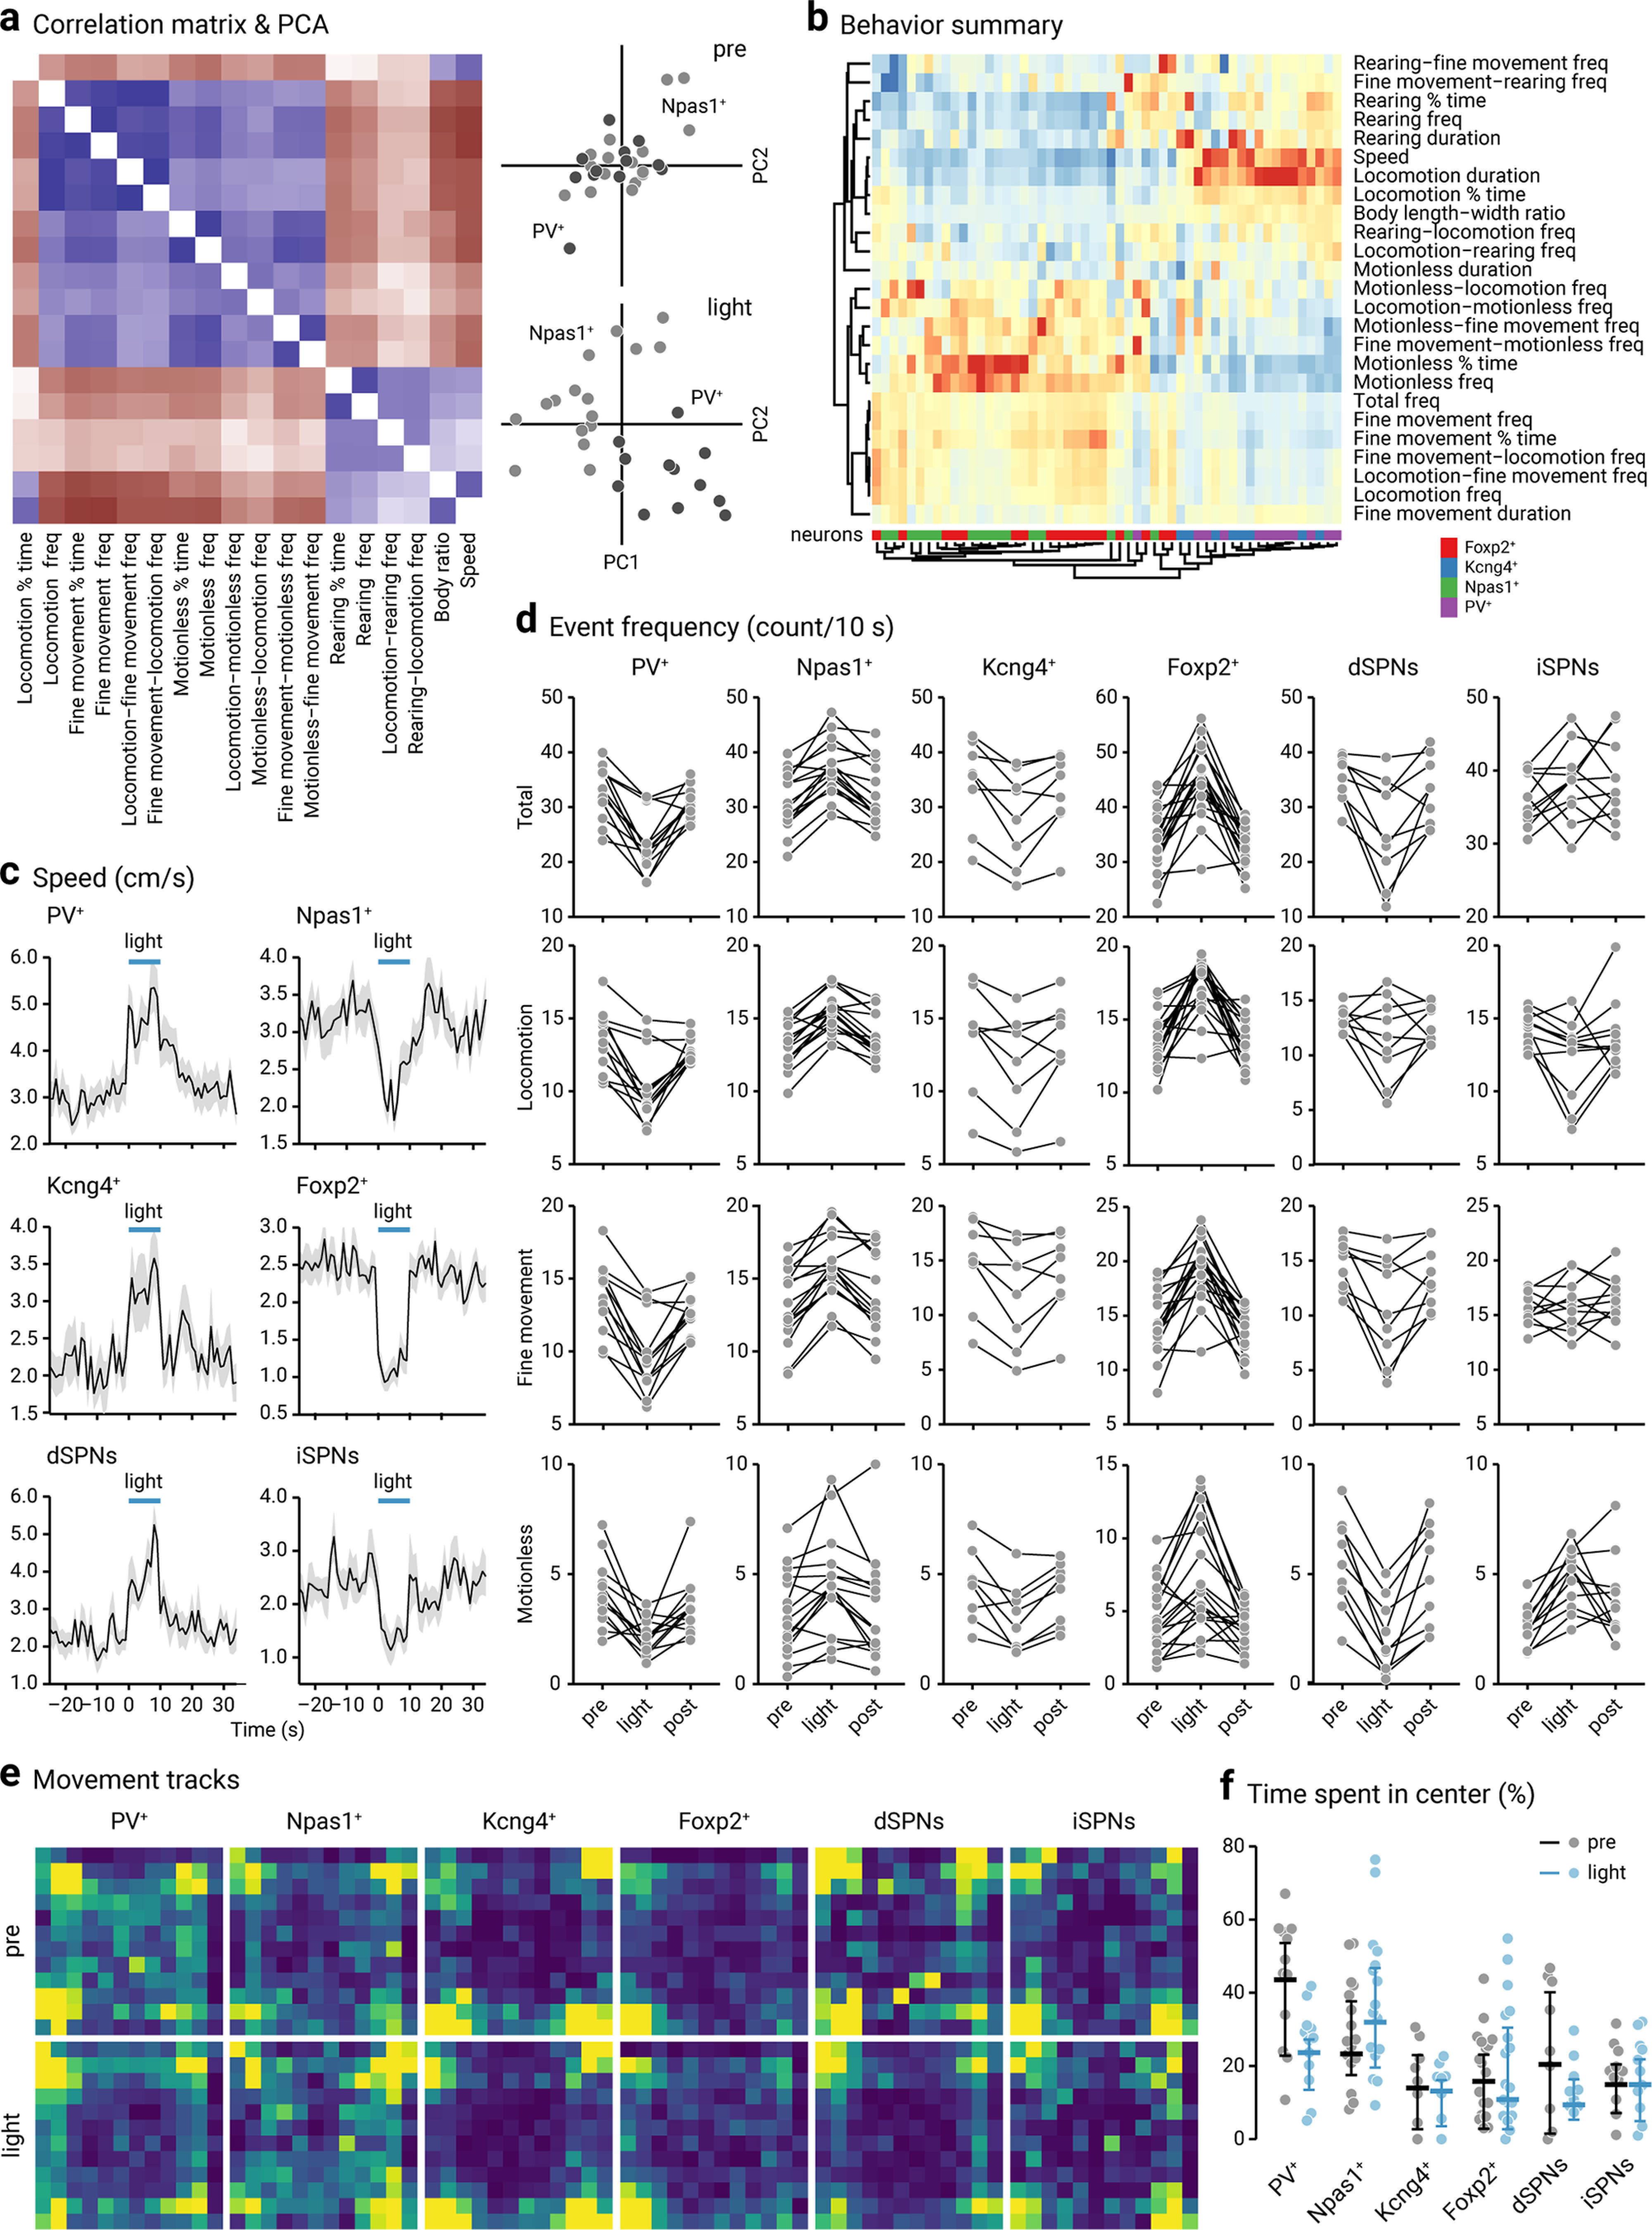
Figure 6.

Motor patterns of mice with cell-specific optogenetic stimulation. a, Left, A correlation matrix constructed using data from PV-Cre (n = 12) and Npas1-Cre (n = 16) mice transduced with ChR2-eYFP. Eighteen parameters were included in this matrix. Blue represents positive correlations. Brown represents negative correlations. Right, Principal component analysis (PCA) plots showing the distributions of PV-Cre (dark gray, n = 12) and Npas1-Cre (light gray, n = 16) mice (transduced with ChR2-eYFP) in pre period (top) and light period (bottom). Each marker represents a mouse. Twenty-three movement metrics were used in this analysis. b, A heatmap summarizing motor responses of mice to optogenetic stimulation of genetically-defined neurons in the GPe. Twenty-five movement metrics were measured to fully capture the behavioral structures. Each of the 25 rows represents the fold change of movement metrics. Warm colors (red) represent positive changes. Cool colors (blue) represent negative changes. Rows and columns were sorted using hierarchical clustering. Dendrograms are divided into two main arms: metrics on the upper arm are negatively correlated with “total frequency,” whereas metrics on the lower arm are positively correlated with “total frequency.” Each column is a mouse; 54 mice were used in this analysis. The neurons of interest are PV+ (purple), Npas1+ (green), Kcng4+ (blue), and Foxp2+ (red) neurons. c, Plots showing the speed of mice with optogenetic stimulation in genetically-defined neurons in the GPe. Blue horizontal lines indicate the timing of light delivery. Thick lines indicate average. Gray areas represent SEM. dSPNs, direct-pathway striatal projection neurons; iSPNs, indirect-pathway striatal projection neurons. d, Slope graphs showing event frequency (counts per 10 s) for total, locomotion, fine movement, and motionless in mice and the effect with optogenetic stimulation of selective neuron types. Each connected line represents a mouse: PV+ neurons (n = 12), Npas1+ neurons (n = 16), Kcng4+ neurons (n = 8), Foxp2+ neurons (n = 18), dSPNs (n = 9), and iSPNs (n = 11). e, Heatmaps showing the relative cumulative time that mice spent in each position following optogenetic stimulation of genetically-defined GPe neurons. Yellow represents more time spent. Blue represents less time spent. Each heatmap was scaled to min and max and does not represent the net locomotor activity of mice. f, A univariate scatter plot summarizing the amount of time mice spent in the center of the area during pre (gray) and light period (blue). Thick lines indicate the medians. Whiskers represent interquartile ranges. PV+ neurons (n = 12), Npas1+ neurons (n = 16), Kcng4+ neurons (n = 8), Foxp2+ neurons (n = 18), dSPNs (n = 9), and iSPNs (n = 11).
