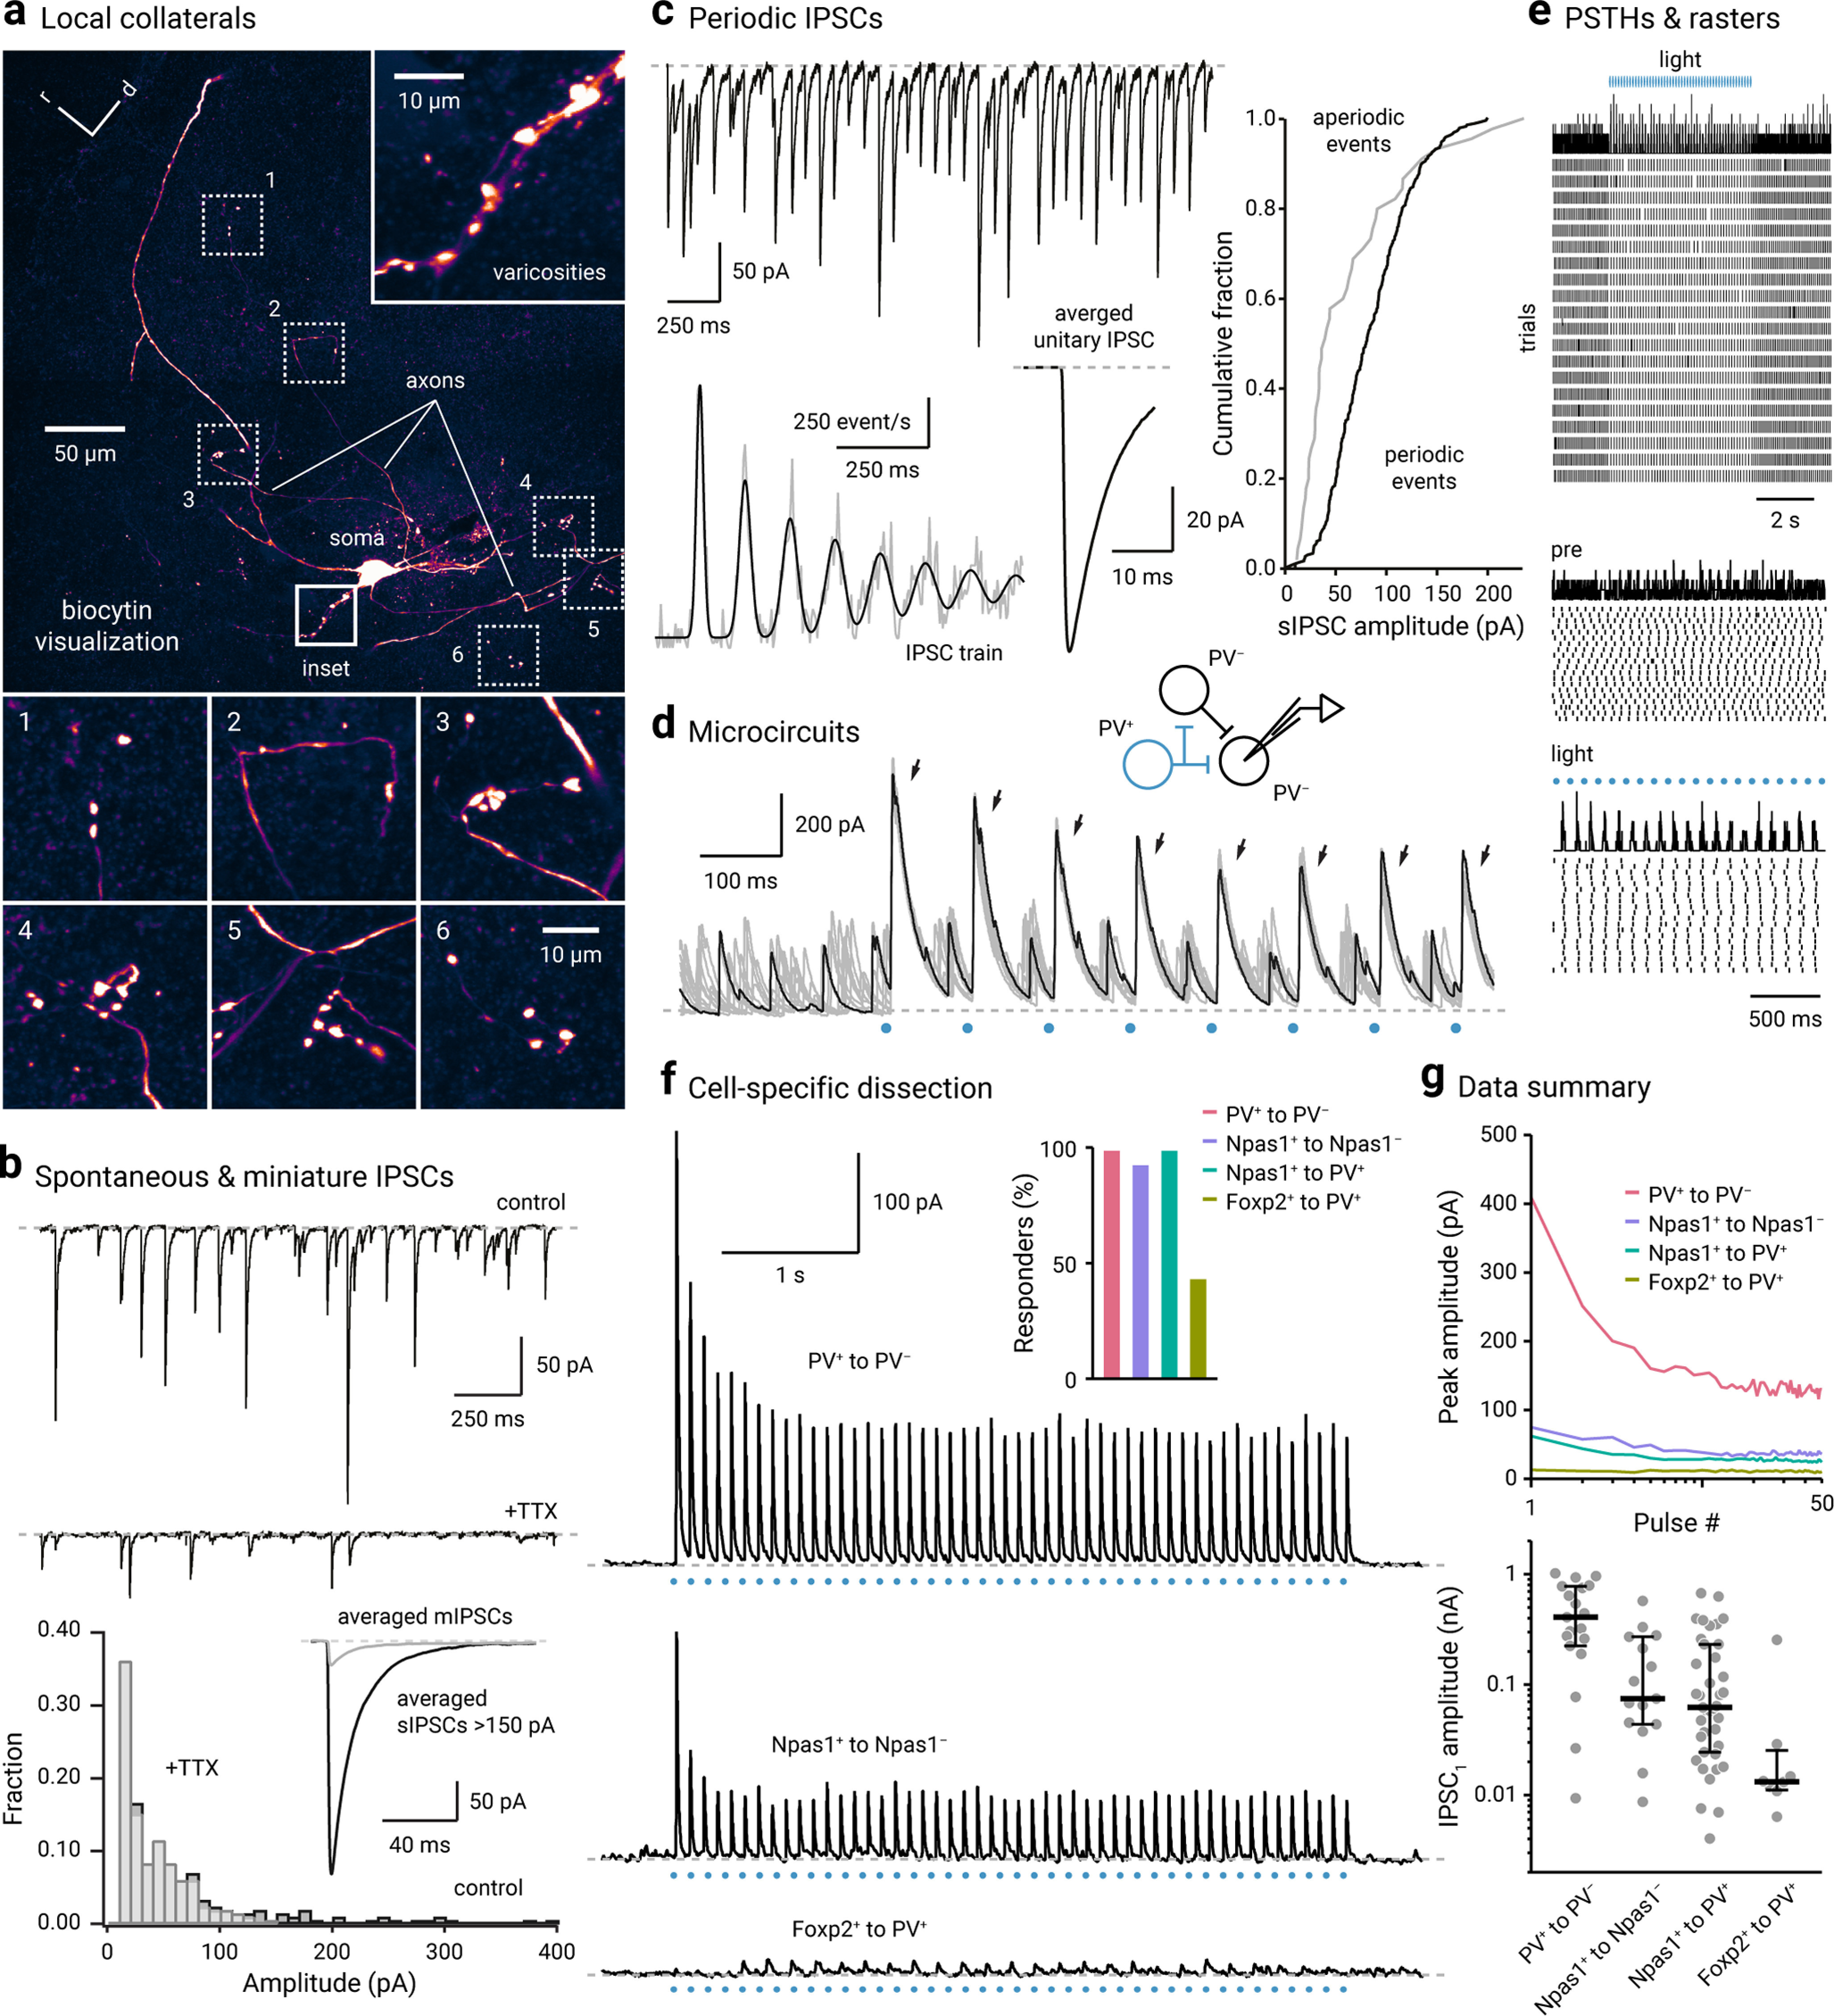
Figure 8.

Local collateral connectivity within the GPe is cell-specific. a, An axon arborized locally in the vicinity of a biocytin-filled GPe neuron. Axons were identified as small-caliber processes that bear varicosities and contain no spines. Top right, Inset, A series of varicosities produced by the biocytin-filled neuron. Bottom, Six additional examples of varicosities and their parent axons are shown. b, Top, Inwardly directed spontaneous inhibitory postsynaptic currents (IPSCs) were readily observed in voltage-clamped GPe neurons ex vivo. Large, periodic events were blocked by the application of tetrodotoxin (TTX) (1 μm), a voltage-gated sodium channel blocker. Bottom, Histogram showing the IPSC amplitude distribution. Inset, Averaged miniature IPSCs (gray) and large (>150 pA) IPSCs (black) are shown. c, Top, A current trace showing periodic IPSCs recorded from a voltage-clamped GPe neuron. Bottom, An autocorrelation of the IPSC train from an example neuron with one unitary input, fitted with a sum of Gaussian components, indicating that the neuron received one periodic input in addition to aperiodic inputs (left). The waveform of the averaged unitary IPSC is shown (right). Right, A cumulative plot showing the difference in the amplitude distribution of periodic (black) and aperiodic events (gray). d, Spontaneous IPSCs and optogenetically evoked IPSCs (arrows) were observed from a voltage-clamped PV– neuron (Vhold = –30 mV). A low-chloride internal solution was used. Light stimuli (blue circle) were delivered asynchronously relative to the occurrence of spontaneous IPSCs. A proposed microcircuit is shown on the top. e, Top, Peristimulus time histogram (PSTH) and raster plot showing the occurrence of spontaneous IPSCs. Evoked IPSCs were excluded. Middle and Bottom, An expanded time scale showing the timing of spontaneous IPSCs was reset by evoked IPSCs. Periodicity is demonstrated by the evenly spaced peaks in the PSTH. No temporal structures in the spontaneous IPSCs were observed before light delivery. f, Local connectivity was dissected using optogenetics ex vivo. Example traces from PV+ to PV– (top), Npas1+ to Npas1– (middle), and Foxp2+ to PV+ (bottom) are shown. ChR2-eYFP negative neurons were targeted for recording. For positive identification of PV+ neurons, PV+ neurons were labeled with the PV-tdTomato allele. Inset, Four connection types were examined: PV+ to PV– (blush, n = 19), Npas1+ to Npas1– (purple, n = 16), Npas1+ to PV+ (green, n = 39), and Foxp2+ to PV+ (olive, n = 18). The proportion of neurons that responded are shown as bar graphs. Only a subset of recorded PV+ neurons (8 of 18, 44.4%) showed detectable Foxp2+ input. g, Top, Population data showing IPSC amplitude for four different connection types across 50 pulses: PV+ to PV– (blush, n = 19), Npas1+ to Npas1– (purple, n = 15), Npas1+ to PV+ (green, n = 39), and Foxp2+ to PV+ (olive, n = 8). Each line indicates median values. Bottom, Univariate scatter plot showing the first IPSC amplitudes for four different connection types. Thick lines indicate the medians. Whiskers represent interquartile ranges. Each circle represents a neuron.
