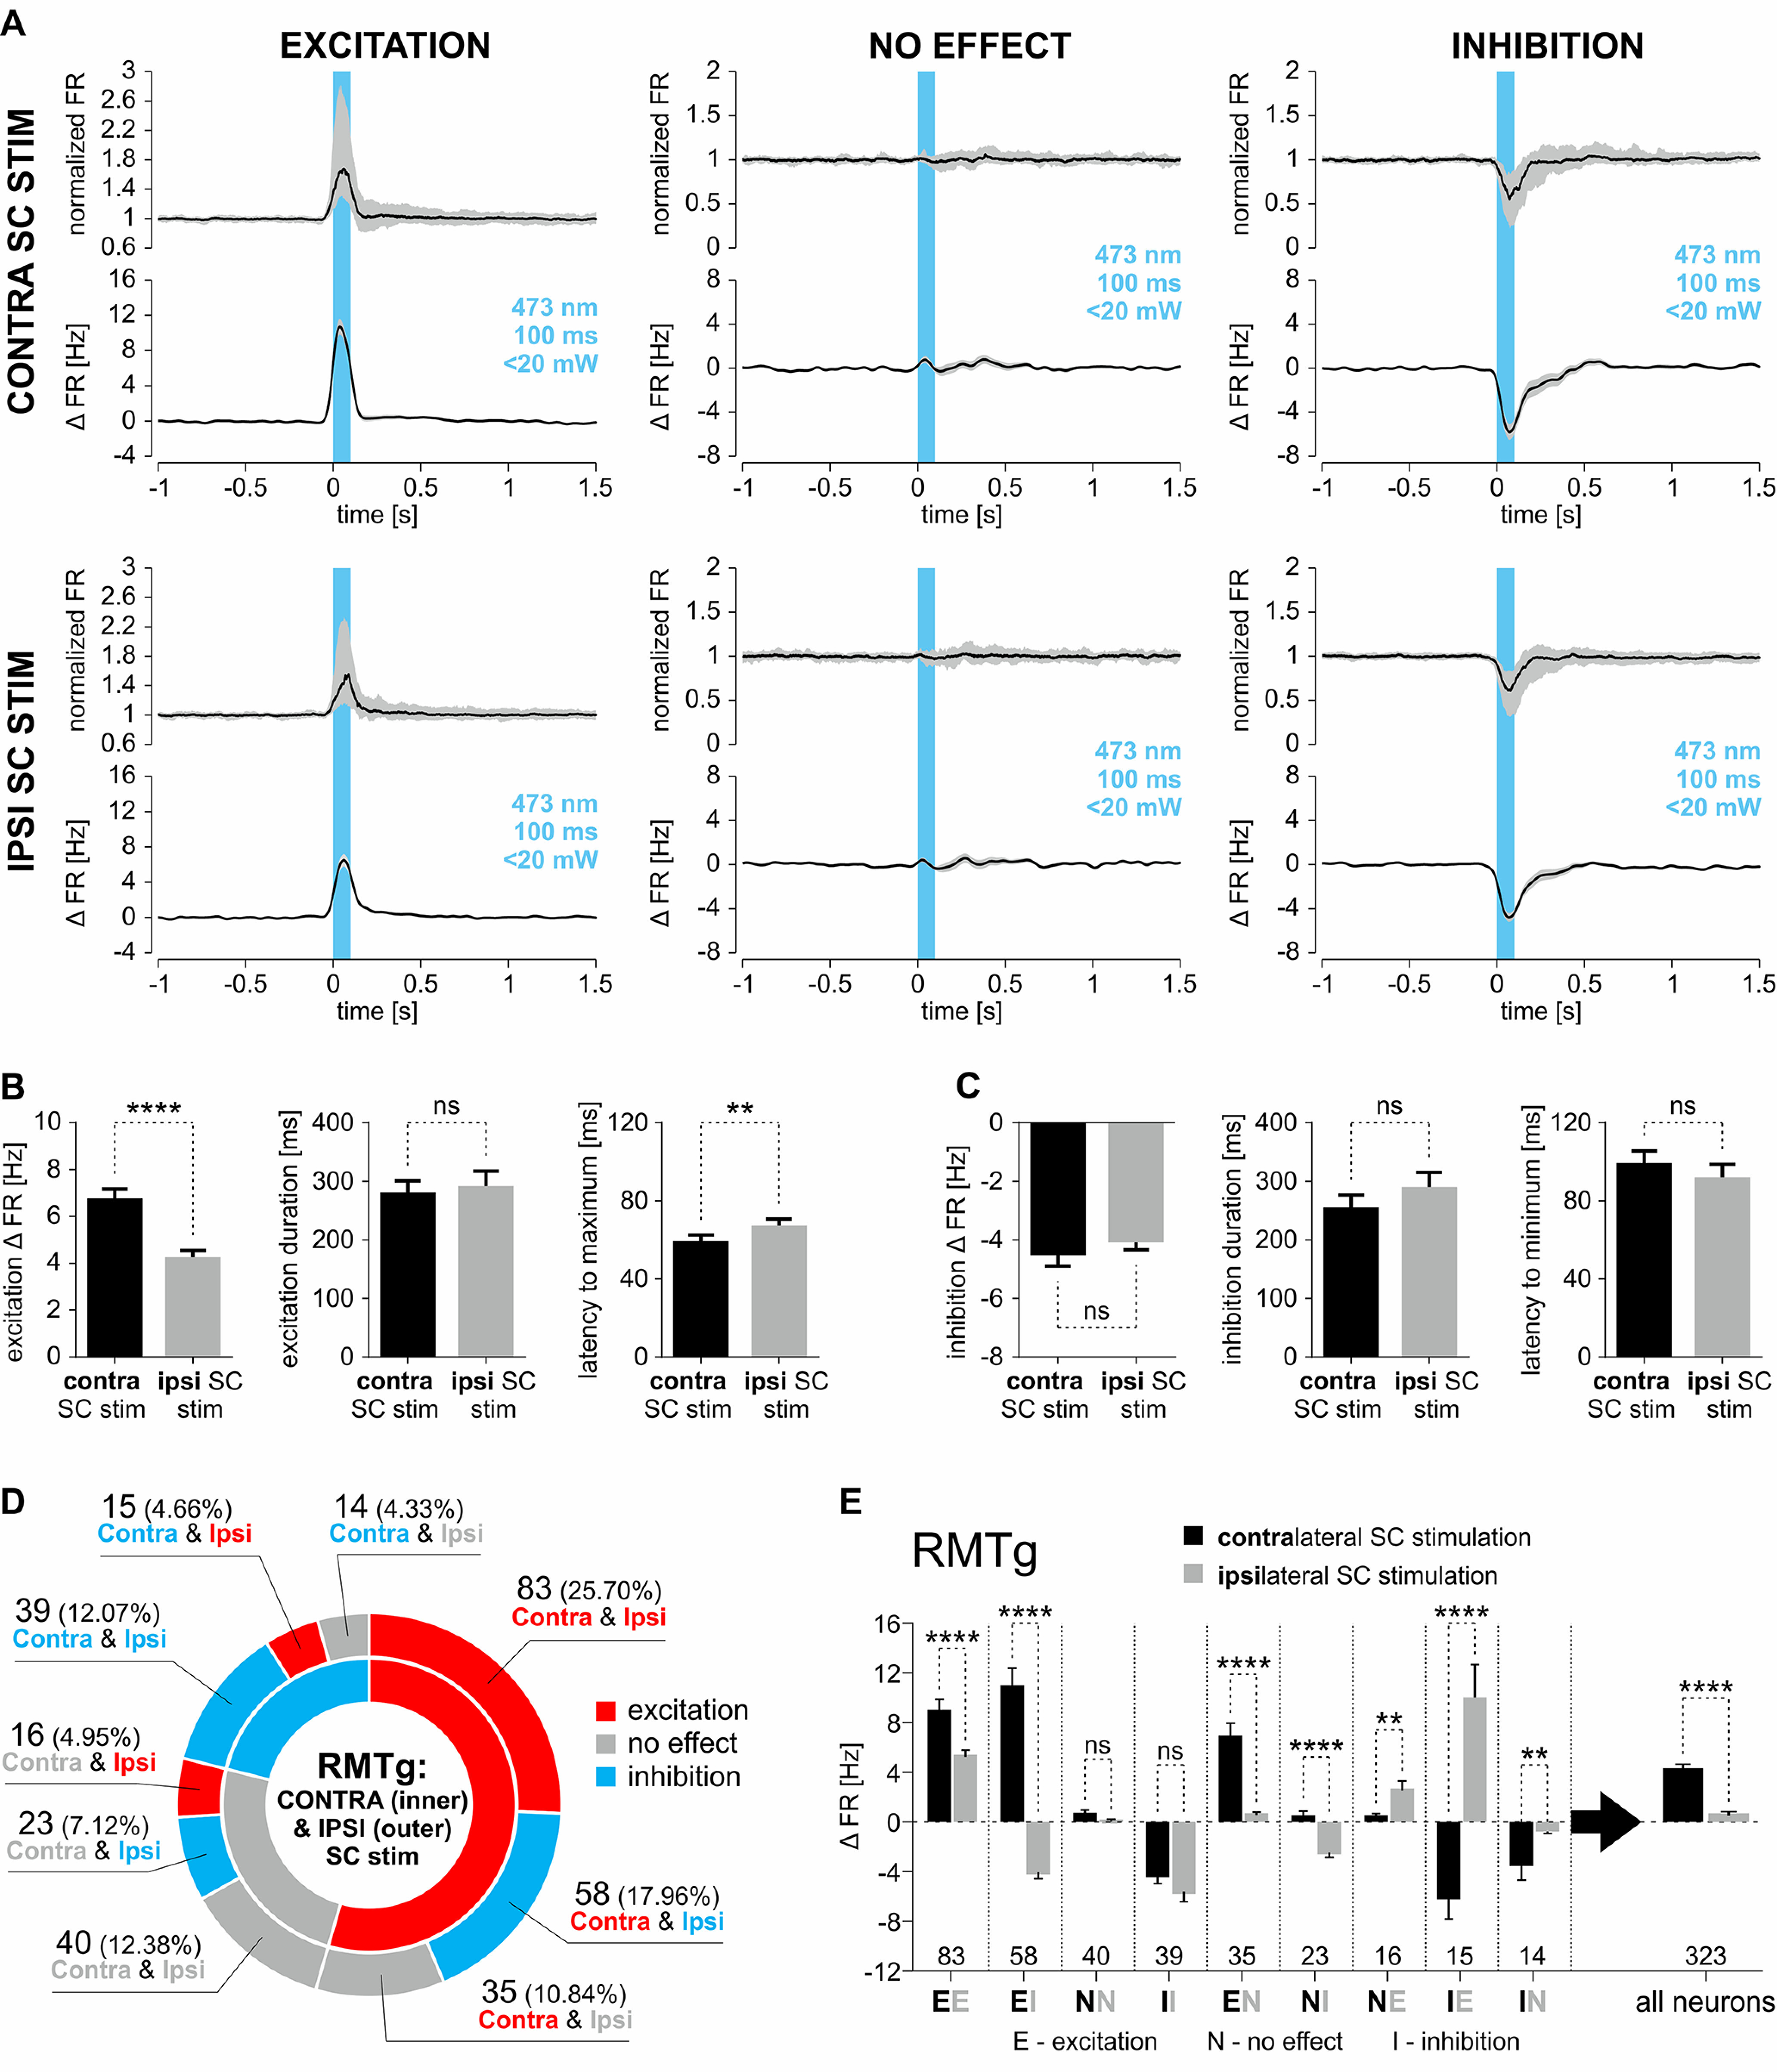
Figure 6.

The comparison of the responses of RMTg neurons to optogenetic stimulation of either contralateral or ipsilateral SC. A, Peristimulus median firing rate (normalized to baseline; interquartile range marked with gray color) and peristimulus mean change in firing rate (±SEM marked with gray color) of RMTg neurons that were either excited or inhibited or did not respond to the stimulation of contralateral (top) or ipsilateral (bottom) SC. The stimulation time is marked with a blue vertical bar (473 nm, 100 ms, <20 mW). B, Parameters of responses of RMTg neurons that were excited by the stimulation of contralateral or ipsilateral SC. Left, Change in firing rate (±SEM). Middle, Duration of the excitatory response (±SEM). Right, Latency to maximum of the response. C, Parameters of responses of all RMTg neurons that were inhibited by the stimulation of contralateral or ipsilateral SC. Left, Change in firing rate (±SEM). Middle, Duration of the inhibitory response (±SEM). Right, Latency to minimum of the response (±SEM). D, Pie chart showing the proportions of RMTg neurons grouped based on combination of response types to the stimulation of both contralateral and ipsilateral SC. E, Change in firing rate (±SEM) of RMTg neurons grouped based on their response (E, excitation; N, no effect; I, inhibition) to the stimulation of contralateral (black solid bars) and ipsilateral (gray solid bars) SC. **p < 0.01, ****p < 0.0001. ns, Nonsignificant.
