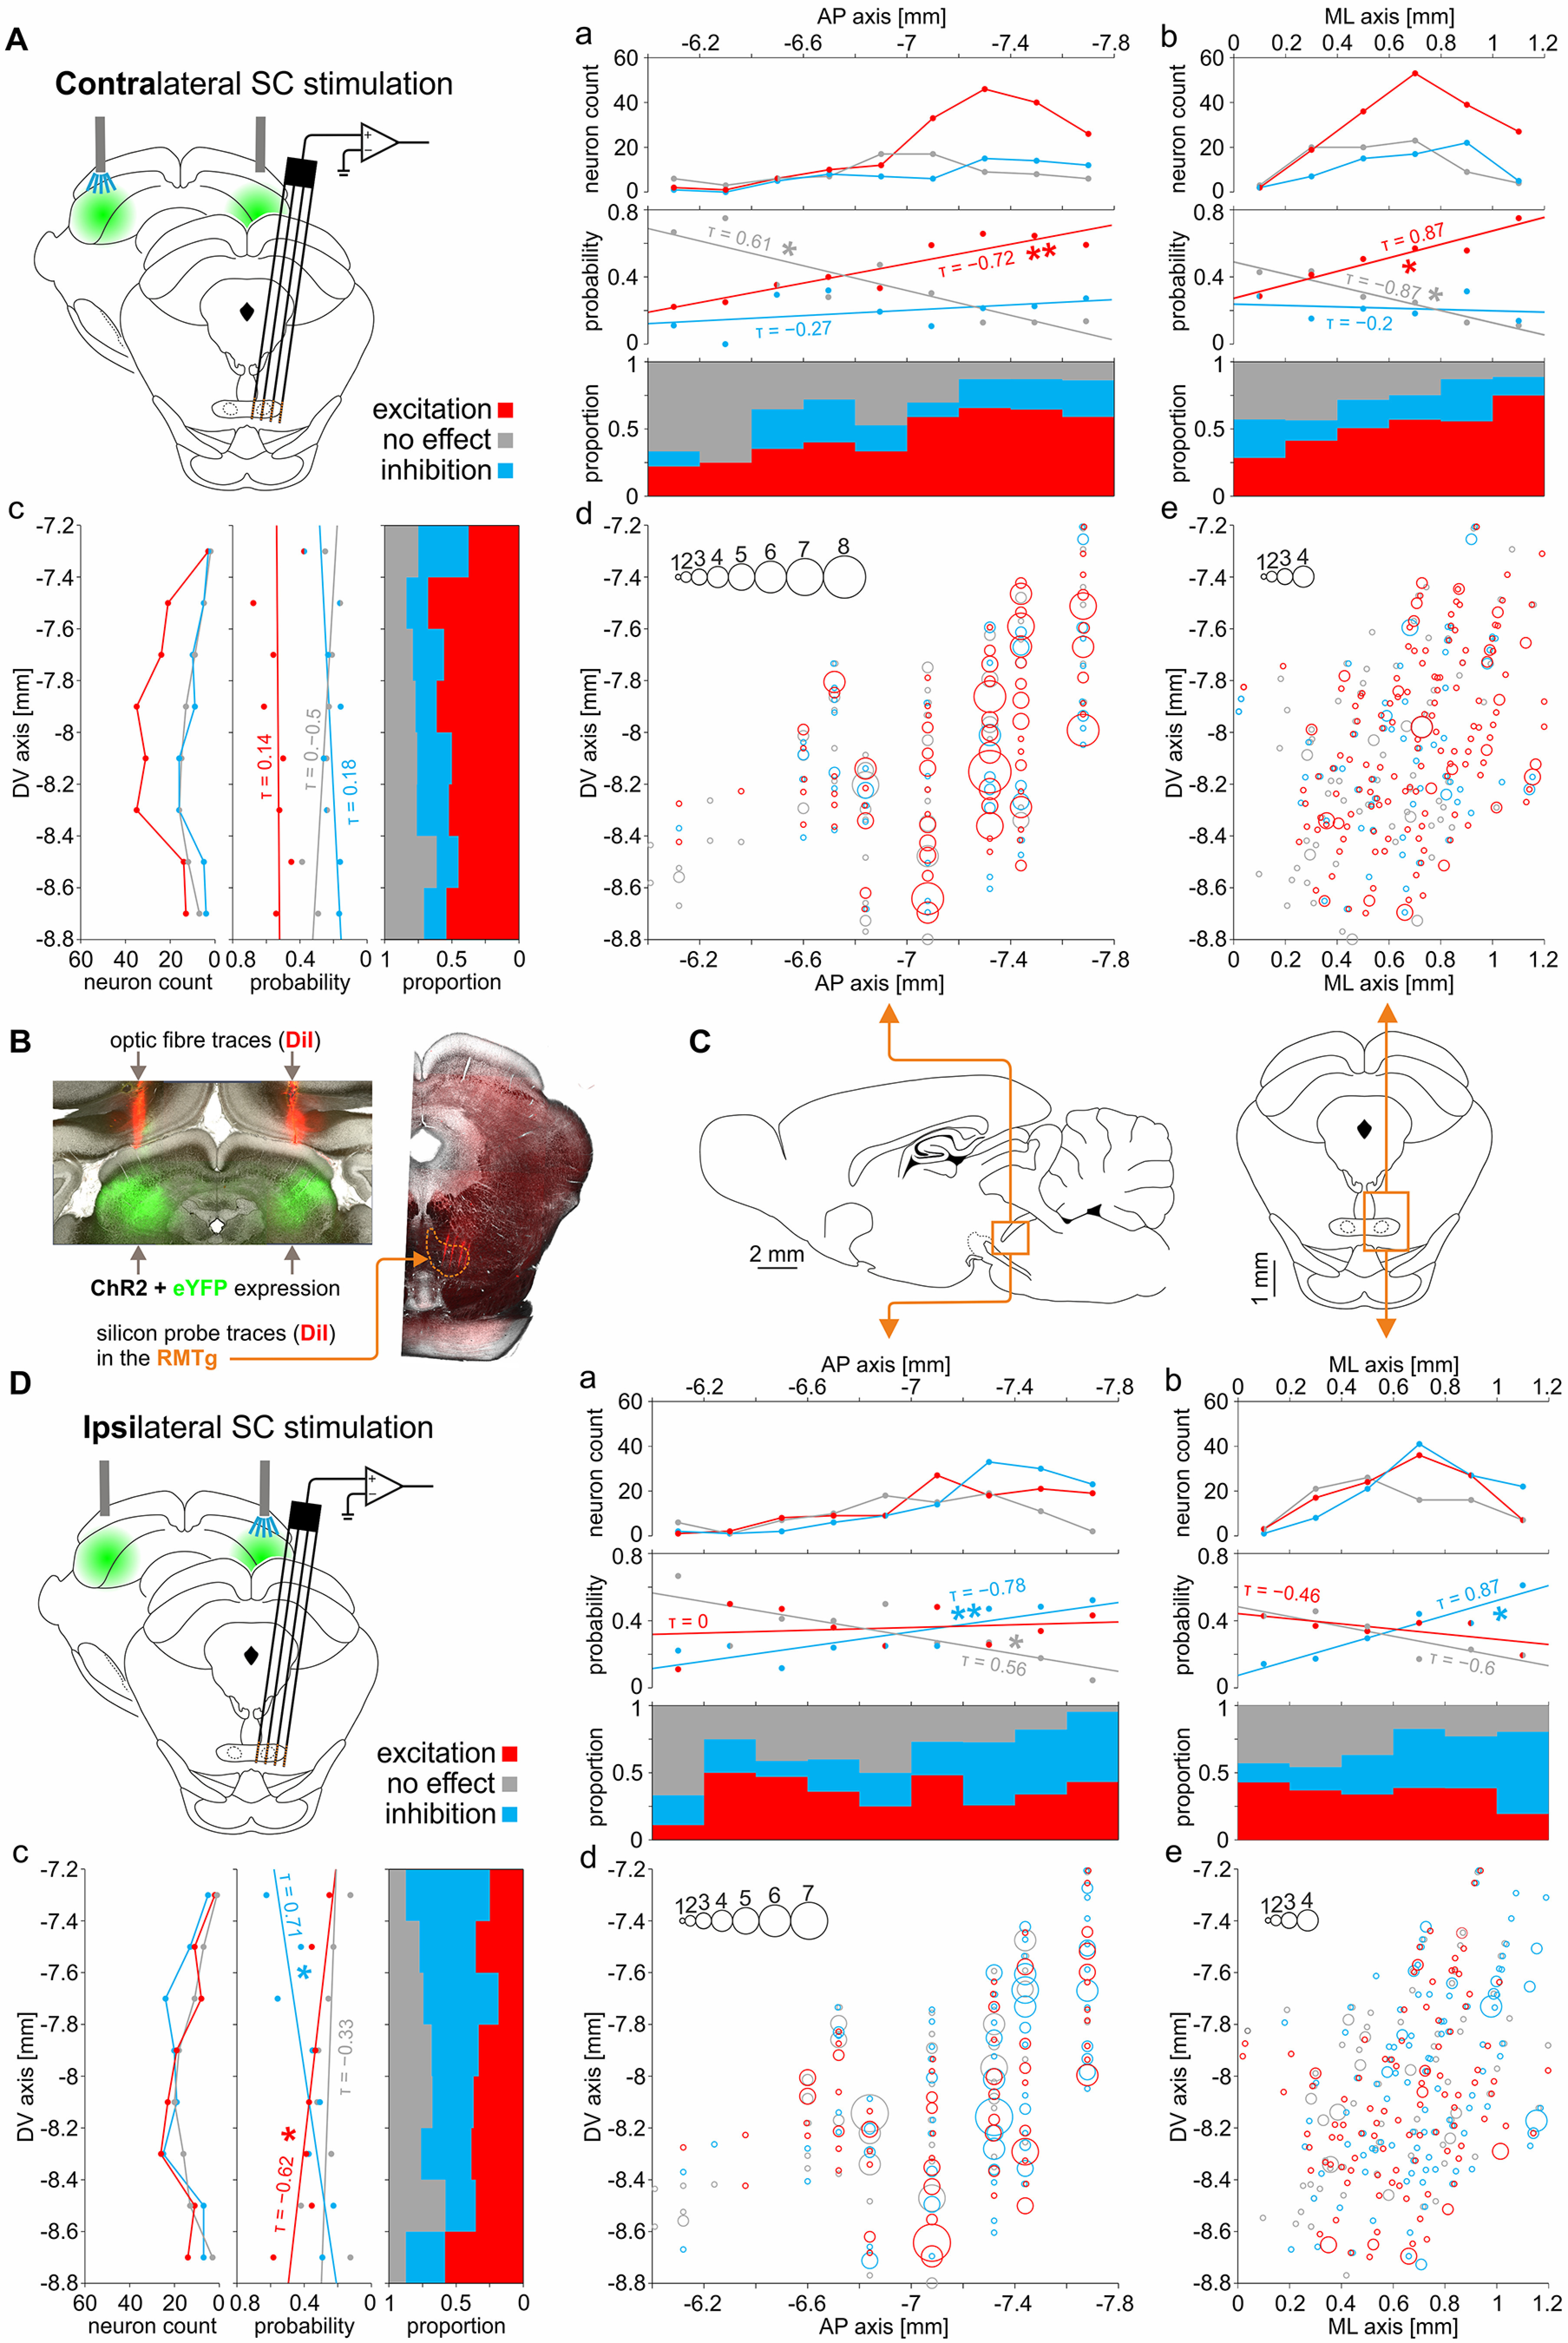
Figure 7.

Spatial distribution of RMTg neurons excited, inhibited, or unresponsive to the optogenetic stimulation of the contralateral and ipsilateral SC. A, d, e, Spatial distribution of the responses of RMTg neurons to stimulation of the contralateral SC, in the DV, the AP, and the ML axes. The number of neurons and the probability of encountering a neuron with a given response type, as well as the proportion of response types in the AP, ML, and DV axes, are shown in a–c, respectively. B, Exemplary images showing the position of the silicon probe shanks (DiI dye traces; red color) within the RMTg, and optical fibers placement (DiI dye traces; red color) above the ChR2-eYFP-expressing (green color) region of SC. The orange dashed line indicates the RMTg boundaries based on the anti-FoxP1 immunostaining. C, Diagram of the brain, in both sagittal (left) and coronal (right) planes, with the area of RMTg used in the spatial distribution analysis, outlined. D, d, e, Spatial distribution of the responses of RMTg neurons to stimulation of the ipsilateral SC, in the DV, the AP, and the ML axes. The number of neurons and the probability of encountering a neuron with a given response type, as well as the proportion response types in the AP, ML, and DV axes, are shown in a–c, respectively. *p < 0.05, **p < 0.01.
