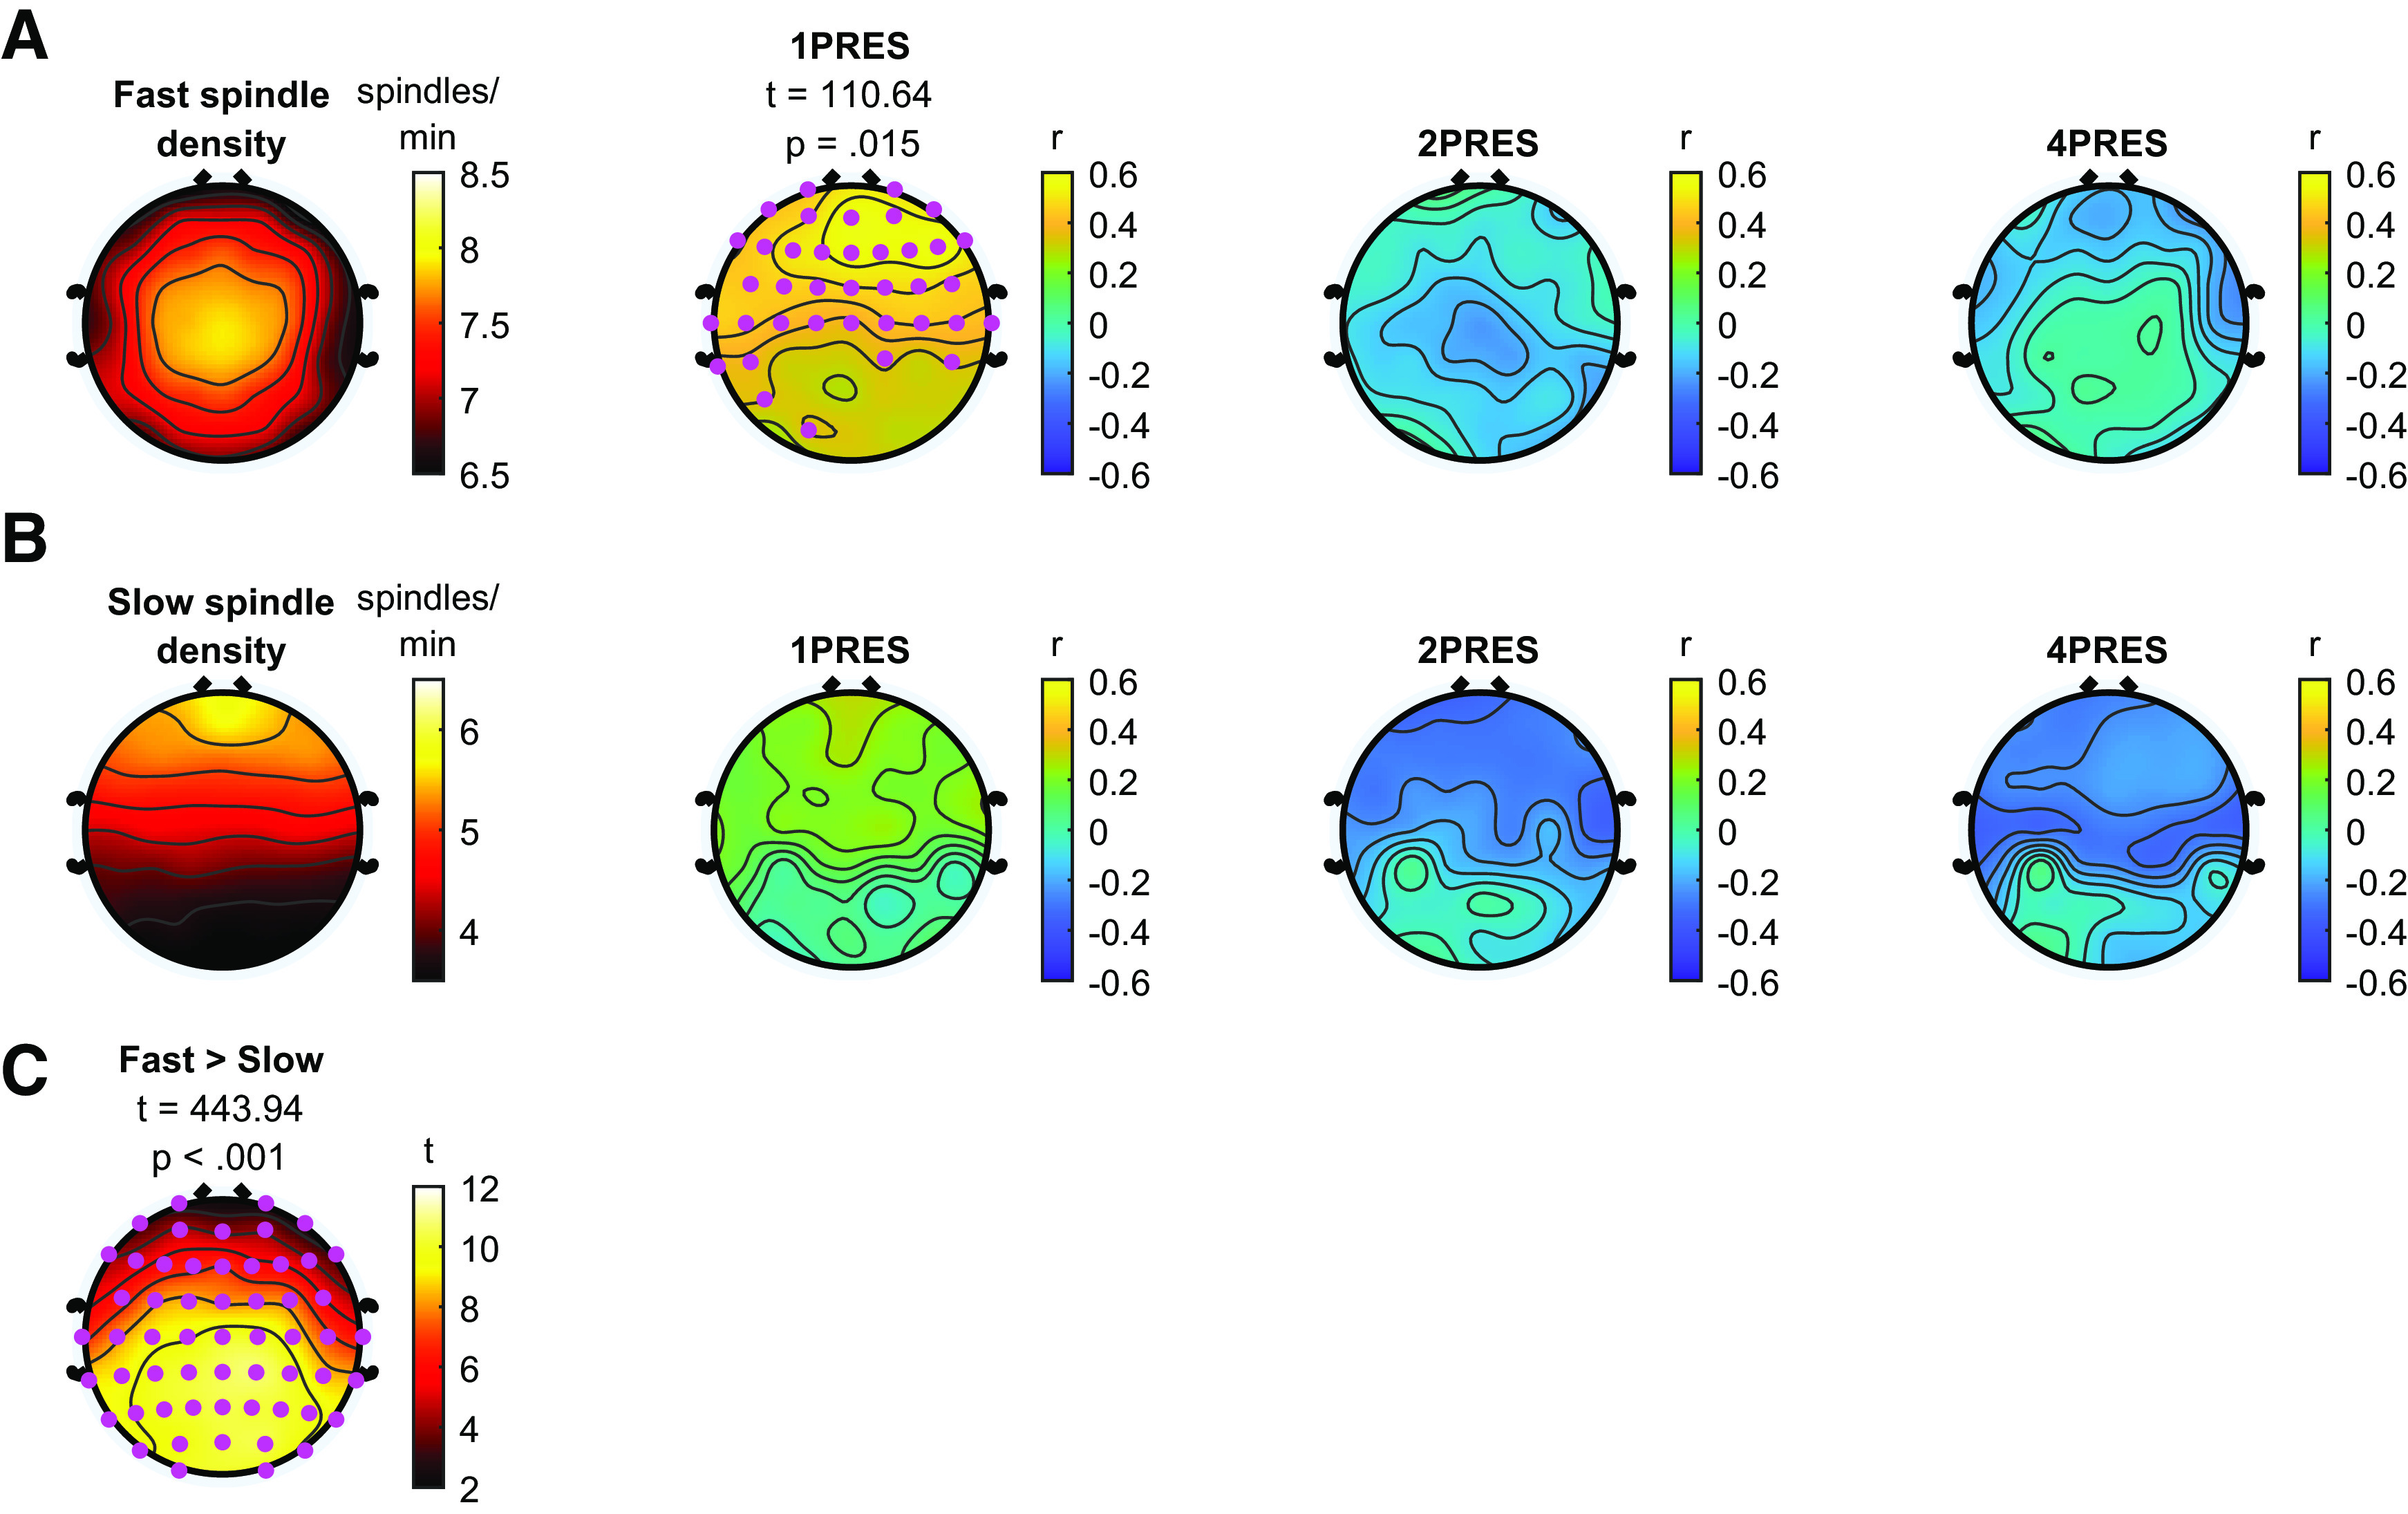
Figure 4.

Sleep spindles during NREM sleep. A, Fast sleep spindles. Fast spindle density (spindles/min) during NREM sleep shown in column 1. Columns 2-4, Correlations between fast spindle density and change in recall for 1PRES, 2PRES, and 4PRES items, respectively. Cluster statistics presented above topographies. Pink dots represent significant electrodes in cluster. B, Slow sleep spindles. Slow spindle density (spindles/min) during NREM sleep shown in column 2. Columns 2-4, Correlations between slow spindle density and change in recall for 1PRES, 2PRES, and 4PRES items, respectively. C, Topography of t values indicating differences between fast and slow spindle density. Cluster statistics presented above topography. Pink dots represent significant electrodes in cluster.
