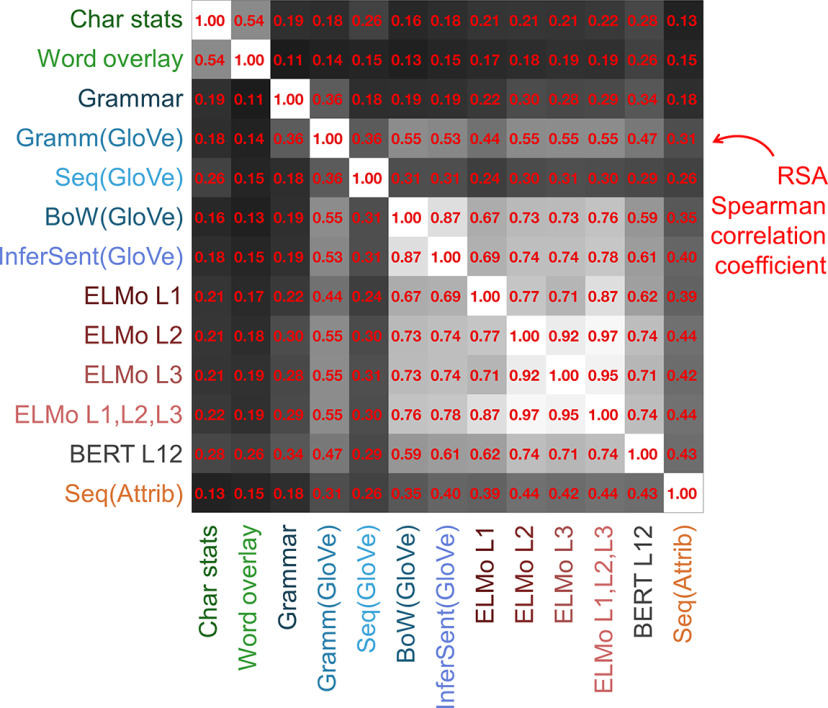
Figure 3.
RSA revealed the interrelationship between the different sentence models tested. Each entry in the matrix corresponds to an RSA between two models. To compute RSA, intersentence Pearson correlation matrices were constructed for each model. To compare models, the below diagonal correlation matrix triangles were extracted from each matrix and vectorized. Spearman correlation was then computed between vectorized triangles corresponding to each model pair. Statistical significance was evaluated by permutation testing. The order of the sentences for one model was randomly shuffled, and the rows and columns of the respective correlation matrix were rearranged according to the shuffled order. The correlation between the vectorized matrix triangle of the shuffled matrix and the triangle of the other unshuffled model matrix was then computed. The 1001 correlation coefficients (associated with shuffled and unshuffled matrix comparisons) were ranked in descending order, and a p-value was computed as the rank associated with the unshuffled coefficient divided by 1001. All correlations displayed were highly significant (p = 0.001). BERT L12 was selected for display post hoc because it yielded strong predictions in later analyses (Fig. 9).

