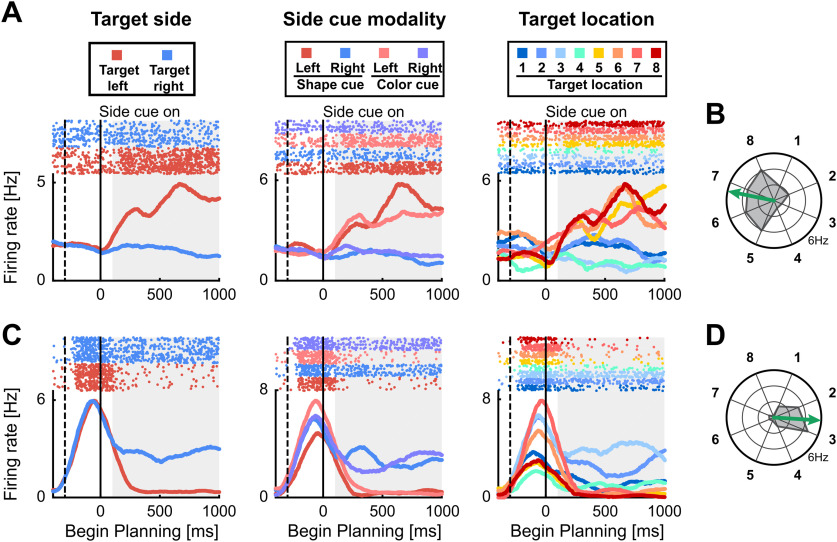
Figure 2.
Neuronal responses to target locations during planning period. Example neurons with selective activity for target side and location. A, C, The first three panels show a dot-raster histograms (top) with corresponding spike-density functions (bottom) aligned to begin of the planning period. In dot-raster histograms, each dot represents an action potential, and each row represents a trial. Spike-density functions show the average firing rate smoothed with a 300-ms Gaussian kernel. Solid vertical lines represent begin of the planning period and dashed vertical lines the begin of the target cueing period. The left panel shows trials sorted by the instructed side. The middle panel shows trials sorted according to all individual side cue types. The right panel shows trials sorted for all eight different instructed target locations. B, D, Polar plots show the firing rate for all eight target positions averaged over the gray shaded area in A, C. The arrow represents the preferred direction of the neuron. A, B, Side-selective example neuron showing preference equal for all target locations on the left side. C, D, Side-and-location selective example neuron showing preference for target positions on the right side, and additional preference for target locations 2 and 3 within the right side.

