Figure 5.

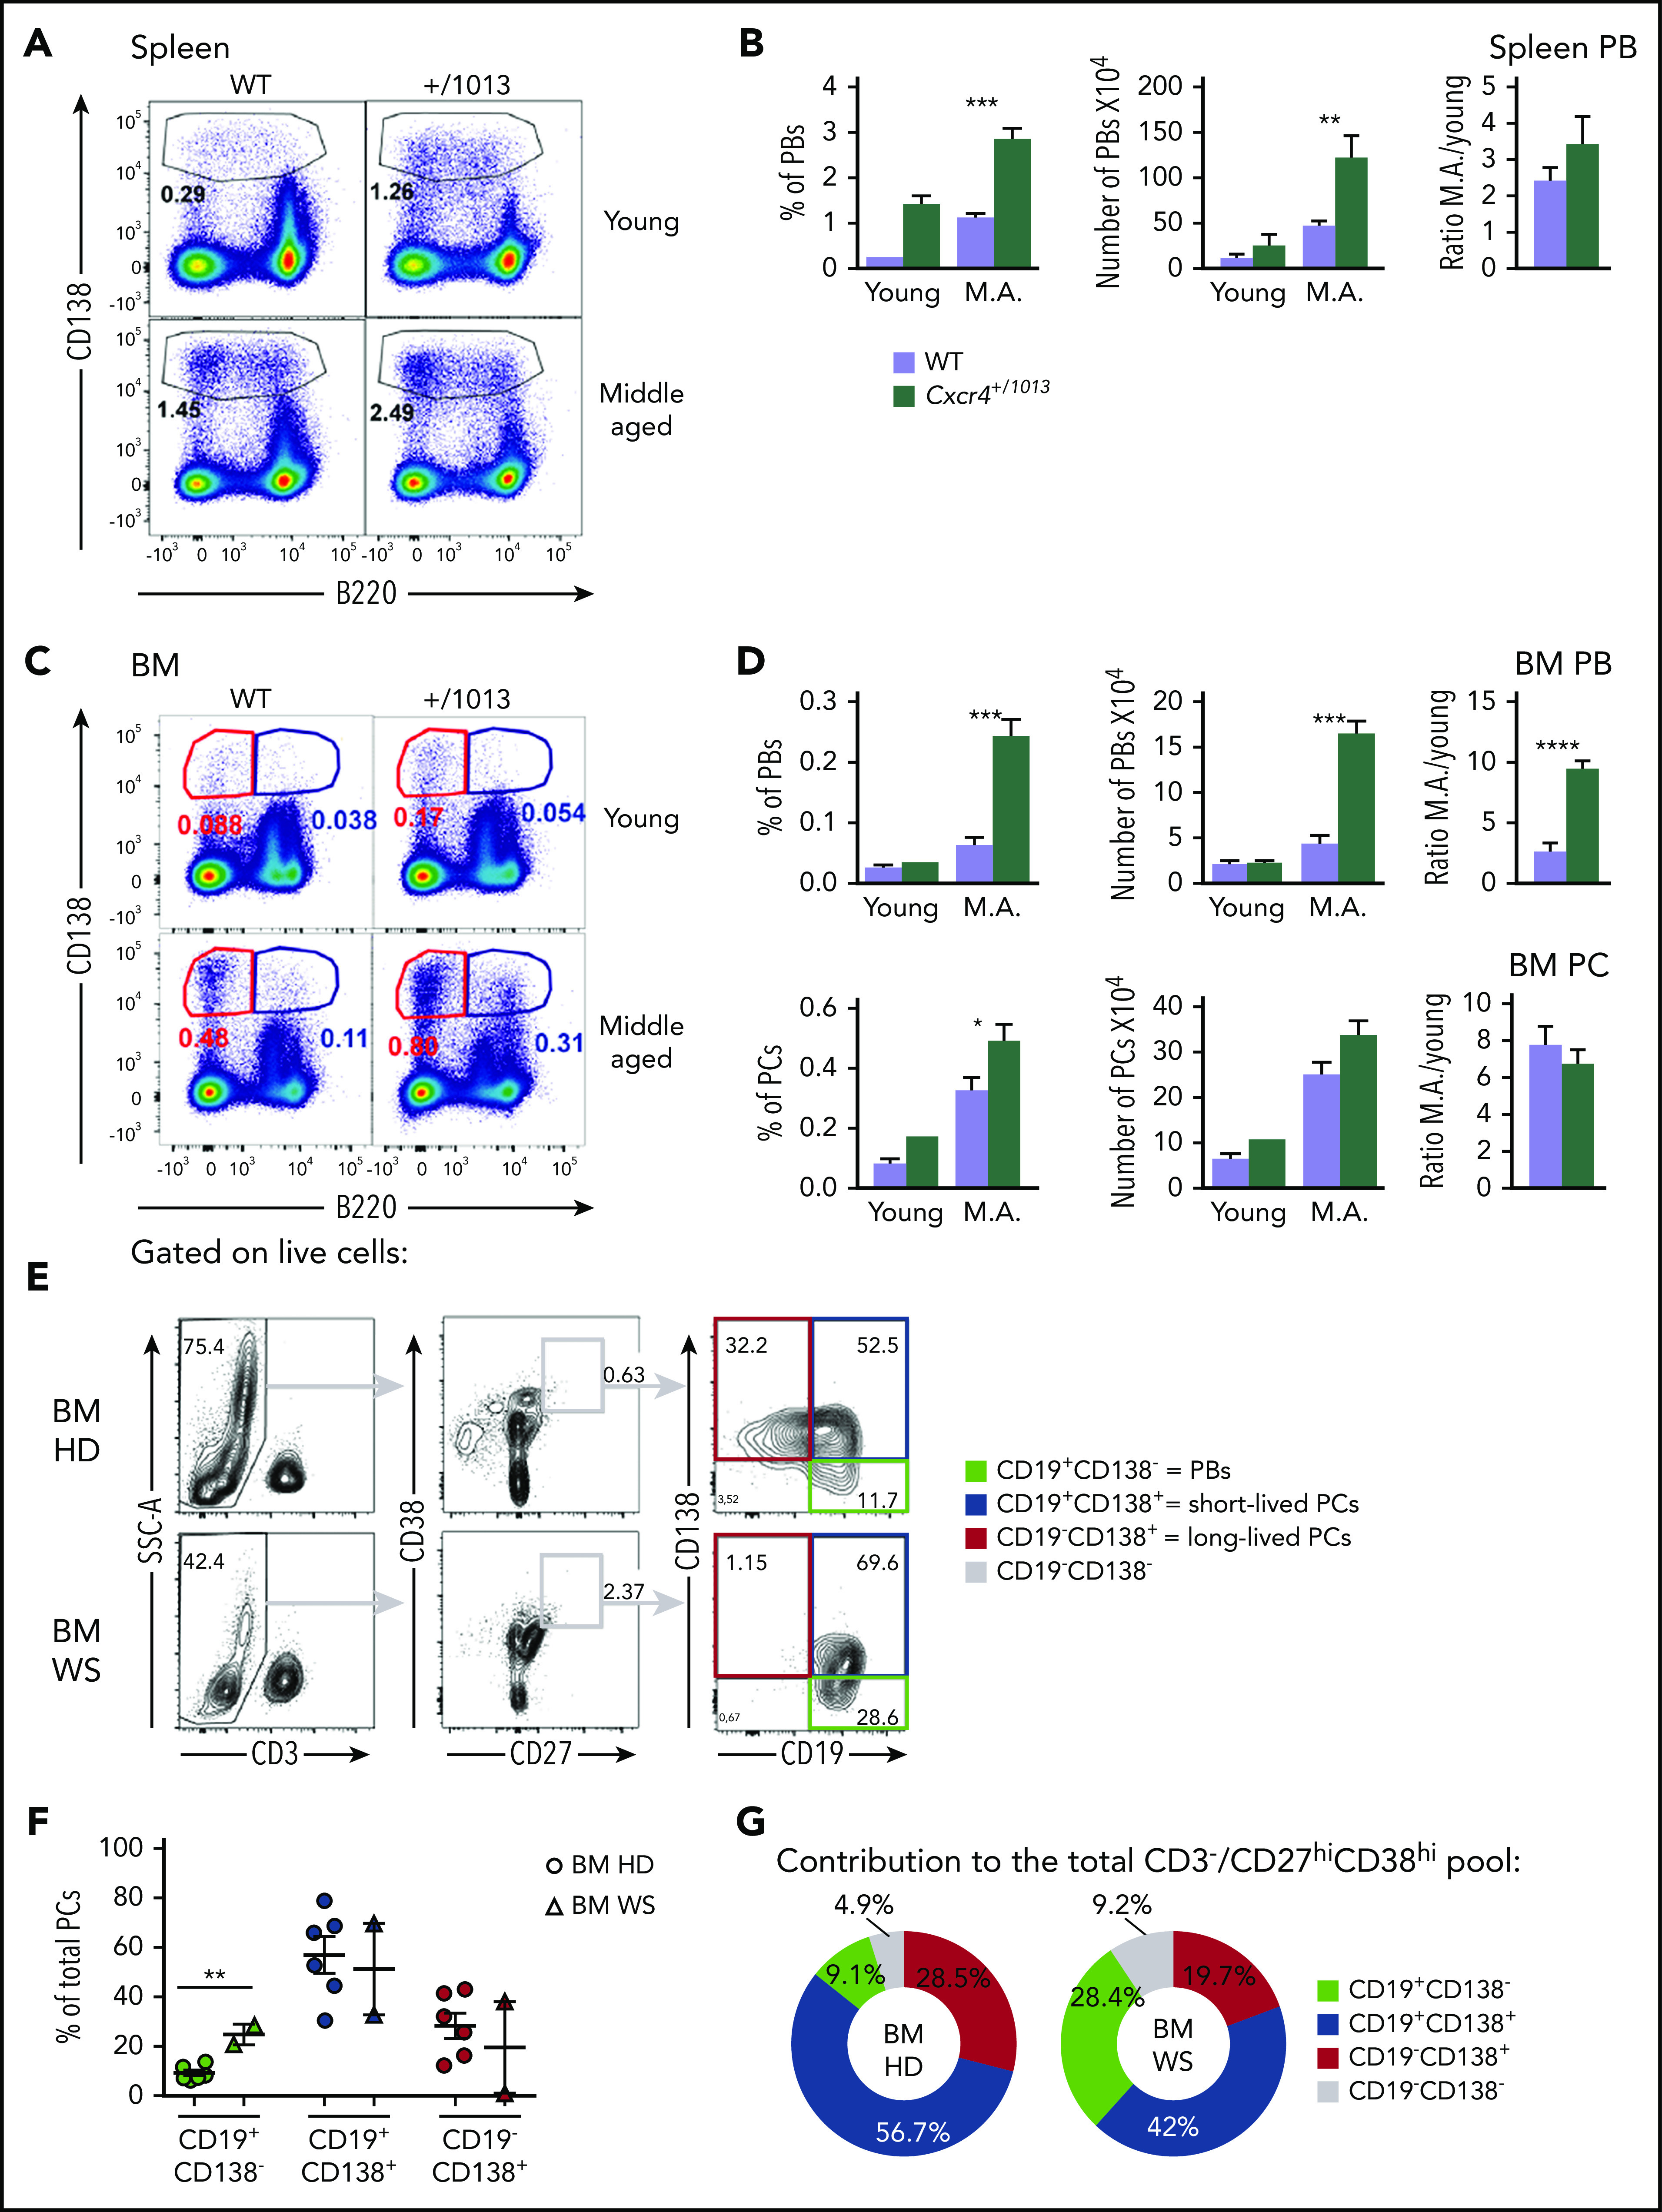
Plasmablasts spontaneously accumulate in the BM in the absence of Cxcr4 desensitization in mice and humans. (A) Representative dot plots showing the gating strategy for PBs in the spleen of young and middle-aged (M.A) mice of both genotypes. (B) Frequency and total number of PBs in the spleen of young and M.A. mice. The ratio M.A./young is also represented. (C) Representative dot plots for PBs (B220lo CD138+) and PCs (B220- CD138+) in the BM of young and M.A. mice from both genotypes. (D) Frequency and total number of PBs and PCs in the BM of young and M.A. mice from both genotypes. The ratio M.A./young is also represented. Results are from 2 independent experiments (mean ± SEM, n = 3-12). Mann-Whitney U test was used to assess statistical significance (*P < .05, **P < .01, ***P < .001, ****P < .0001). (E) Representative dot plots for the gating strategy of the different PB/PC subsets in the BM of control healthy donor (HD) and WS patients. Mononuclear cells were gated on FSC-A/SSC-A, doublets, and dead cells were excluded. On the live cells, T cells were excluded, and total PB/PC were gated as CD27hiCD38hi. The 3 PB/PC subsets were gated based on the expression of CD19 and CD138 from the less to the more mature: CD19+CD138− (green box), CD19+CD138+ (blue box), and CD19−CD138+ (red box). (F) Flow cytometry–based quantification of the frequency of the 3 subsets among total PCs for control and WS BM. (G) Pie chart representation of the contribution of each PB/PC subset to the total BM pool for the control and WS samples. The average contribution of the 3 subsets to the total PC pool for control and WS BM is shown. n = 6 for the control BM and n = 2 for the WS BM. Unpaired t test was used to assess statistical significance (**P < .01).
