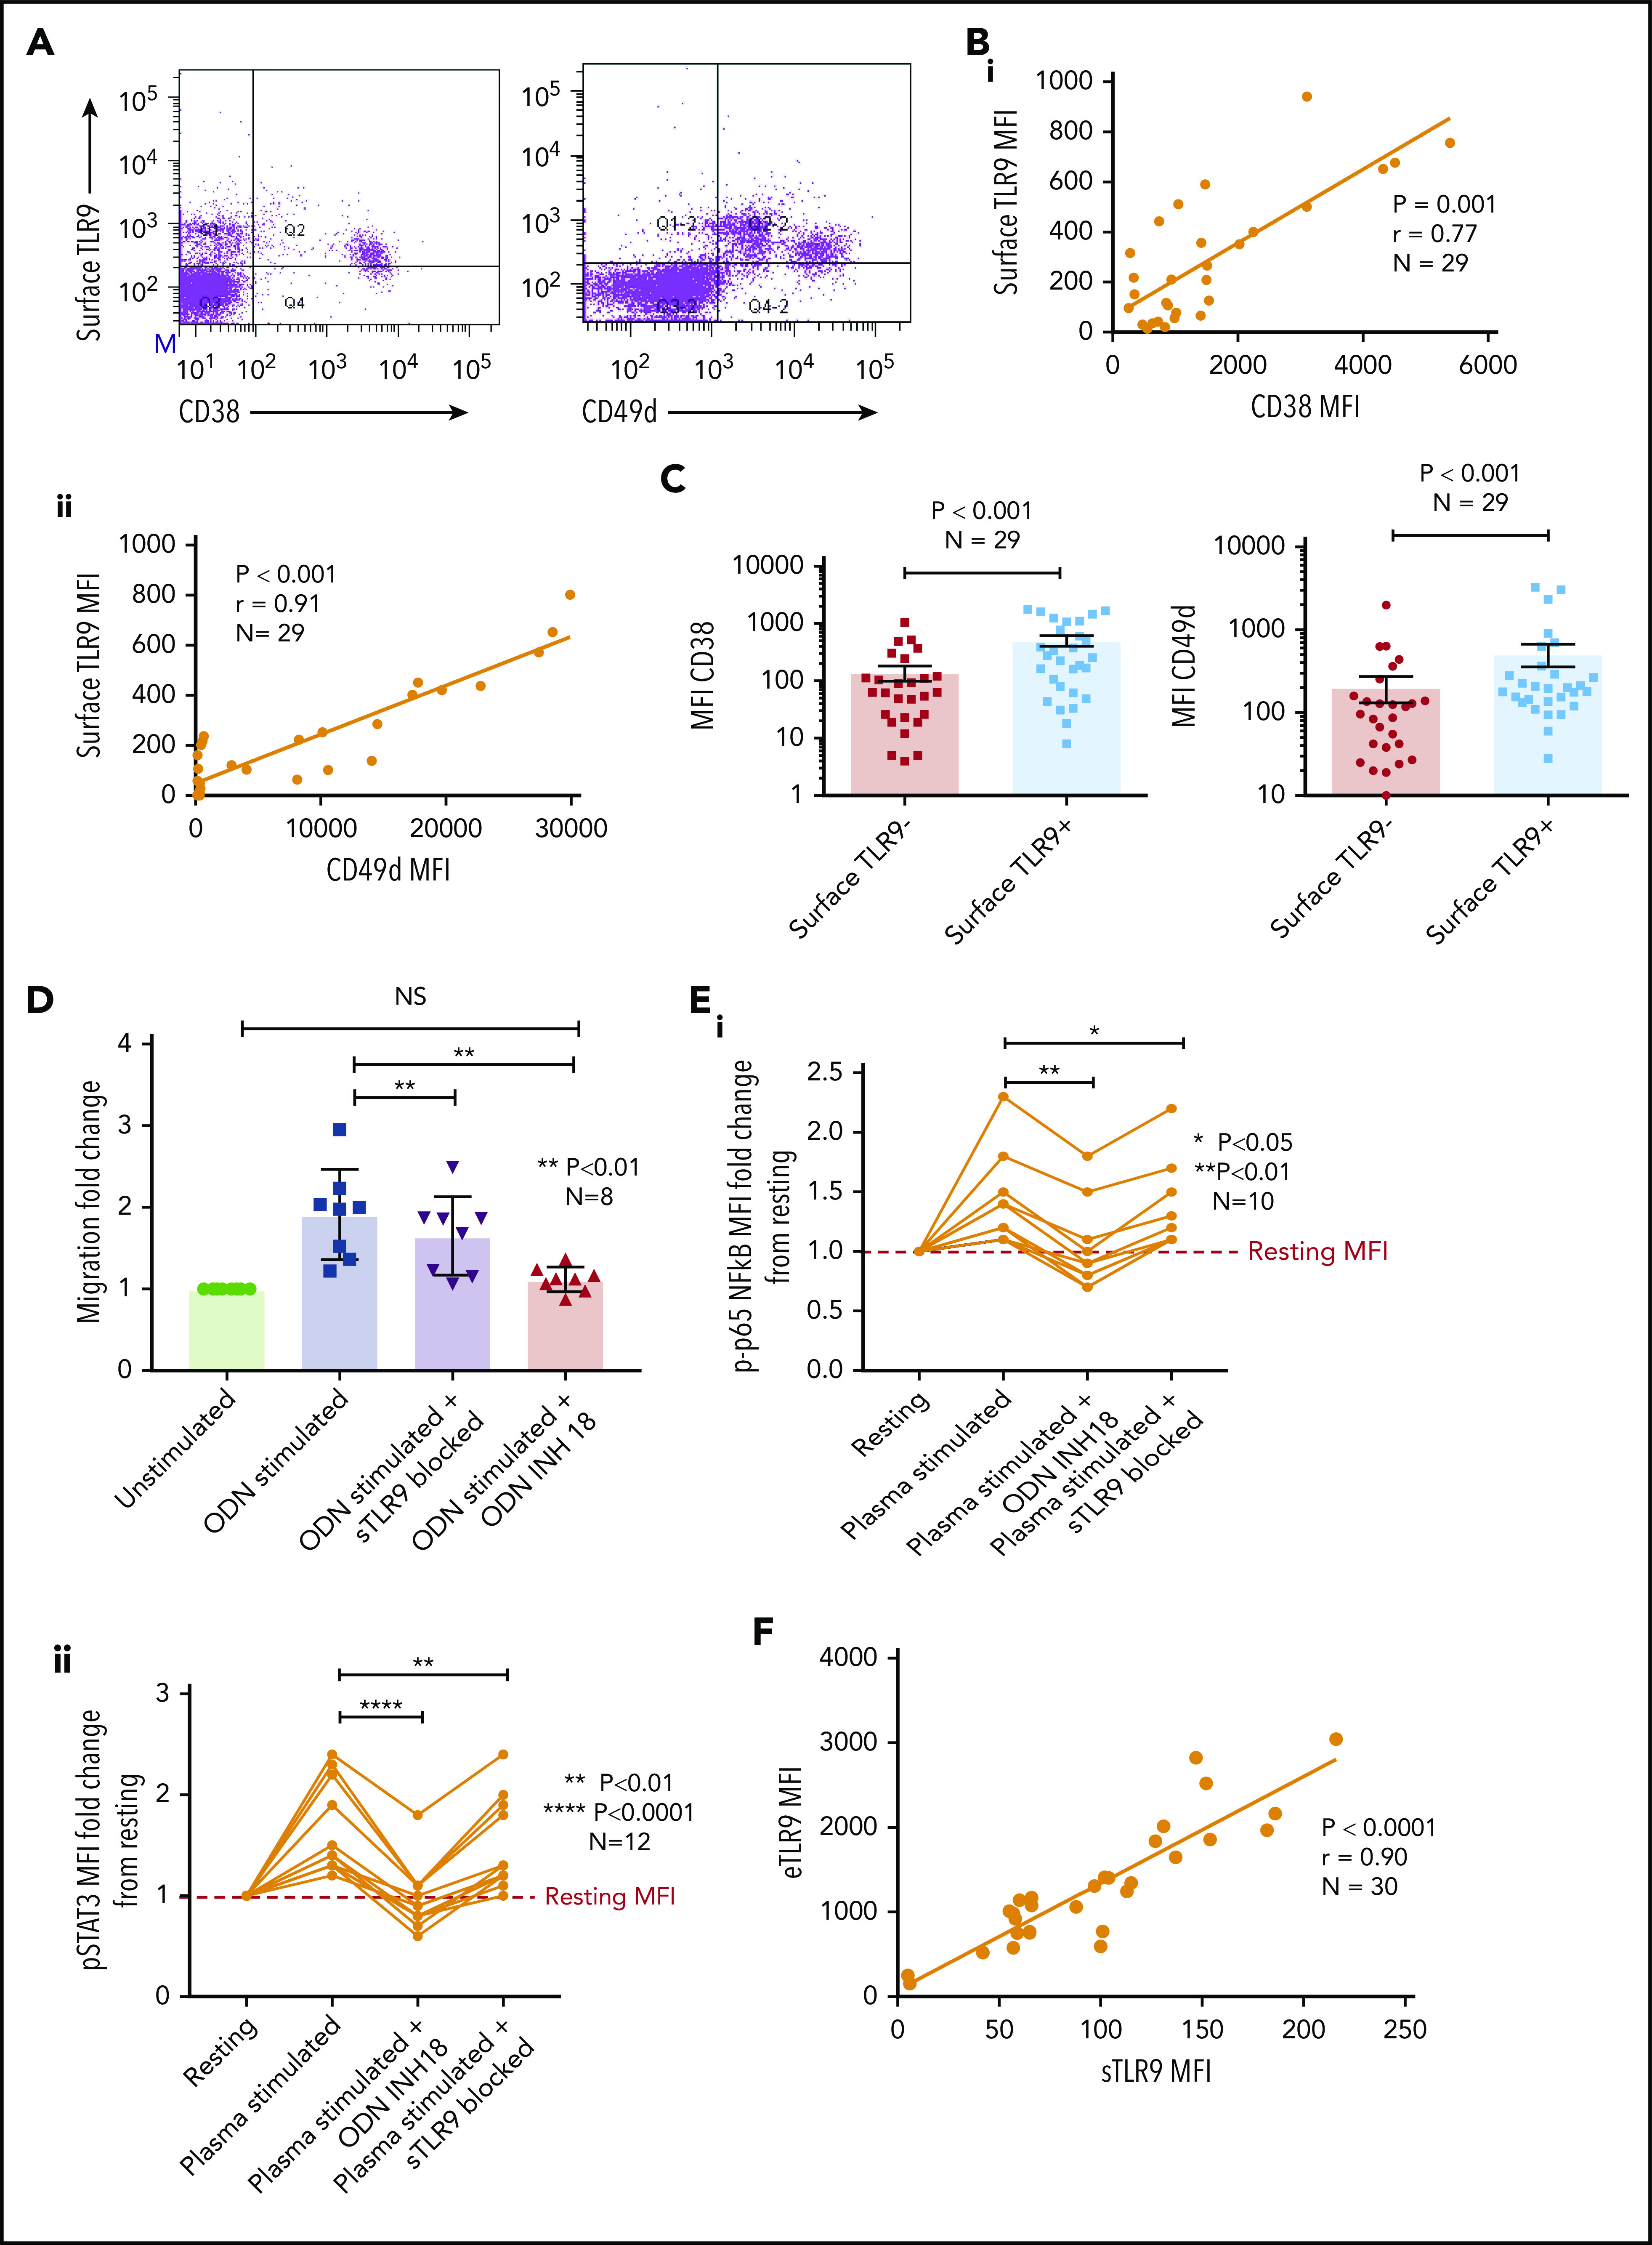
Figure 4.

A small proportion of CLL cells with an aggressive phenotype and high levels of eTLR9 express functional sTLR9. Unstimulated primary PBMCs from 29 patients with CLL were stained with antibodies to CD5, CD19, CD38, CD49d, sTLR9, and a viability dye. Cell were assessed by using flow cytometry and positivity determined by fluorescence minus one. (A) Representative figure showing CLL cells from a patient with very high levels of sTLR9 expression. Viable CD5+CD19+ CLL cells were gated on and sTLR9 plotted against either CD38 or CD49d. The majority of sTLR9-positive CLL cells are positive for CD49d and many for CD38 as well. (B) CD5+CD19+CD38+ (i) and CD5+CD19+CD49d+ (ii) CLL cells from all 29 patients were gated on and the MFI of CD38, CD49d, and sTLR9 established. There is a clear positive correlation between the MFIs of both CD38 and CD49d with that of sTLR9. (C) Using a different 29 patient cohort, viable CD5+CD19+CLL cells were gated on and the sTLR9-positive and sTLR9-negative populations were further gated on. The MFI of CD38 and CD49d was established on both sTLR9-positive and sTLR9-negative populations, and within every patient, both CD38 and CD49d are much more highly expressed in the sTLR-positive population compared with their negative counterparts. (D) PBMCs from 8 different patients with CLL were split into 4 fractions. One fraction was preincubated with an antibody to block sTLR9 and one with ODN INH-18 to block tTLR9. Both these fractions of cells, and an untreated fraction, were then stimulated with ODN2006 overnight. The fourth fraction remained unstimulated. After overnight incubation, cells were harvested and then transferred into transwell migration chambers and incubated for 4 hours; cells migrated toward a CXCL12 (100 ng/mL) gradient. The migrated and nonmigrated cells were collected, stained with CD5 and CD19 for CLL cell identification, and then quantitated volumetrically. The fold change compared with the normalized unstimulated fraction was then assessed. The ODN2006 prestimulated CLL cells had greater levels of migration compared with the unstimulated fraction. This was marginally reduced after the blocking of sTLR9 but abrogated to the resting level in the presence of tTLR9 inhibition. (E) The same experiment was repeated by using autologous plasma stimulation for a 4-hour period and then cells collected, stained with CD5, CD19, and either an isotype matched control or p-p65 NF-κB (i) or p-STAT3 (ii). p-p65 NF-κB and p-STAT3 MFIs were quantified and the fold change compared with the normalized unstimulated fraction assessed. Both were upregulated in the presence of plasma, and this was very marginally reduced with sTLR9 blocking but much more with tTLR9 blockade. (F) eTLR9 and sTLR9 levels were compared on CLL cells from 30 different patients. Samples were split into 2 fractions; one was stained with CD5, CD19, and permeabilized for eTLR9 staining and the other with CD5, CD19, and sTLR9. For each, the CD5+CD19+ CLL cells were gated on and the MFI of the TLR9 quantified. There is a very strong correlation between the levels of eTLR9 and expression of sTLR9. NS, not significant.
